Figures & data
Table 1. Patient, tumor and treatment characteristics.
Figure 1. Local control rates after surgery and adjuvant radiotherapy (RT), RT alone, and for the overall group.
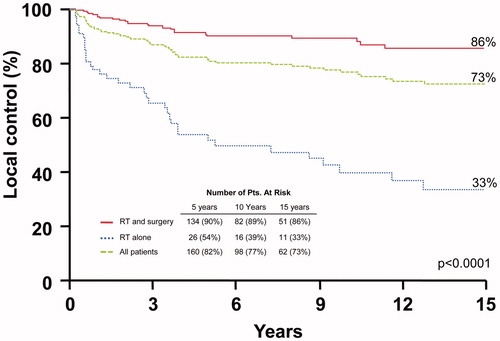
Figure 2. Local-regional control rates after surgery and adjuvant radiotherapy (RT), RT alone, and for the overall group.
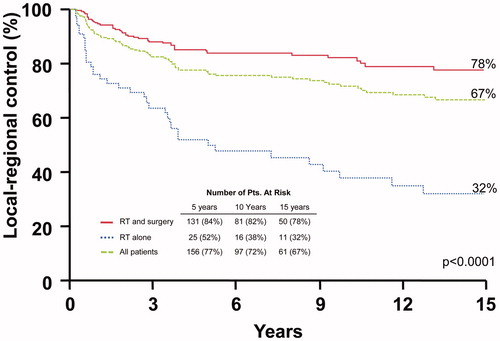
Figure 3. Distant metastasis-free survival rates after surgery and adjuvant radiotherapy (RT), RT alone, and for the overall group.
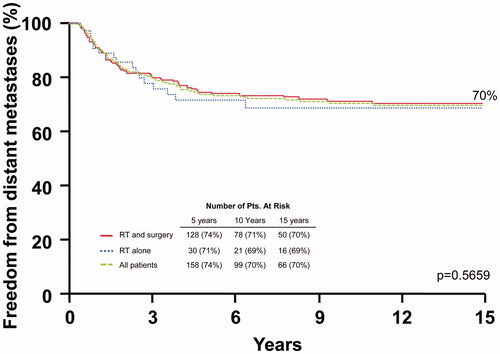
Figure 4. Cause-specific survival rates after surgery and adjuvant radiotherapy (RT), RT alone, and for the overall group.
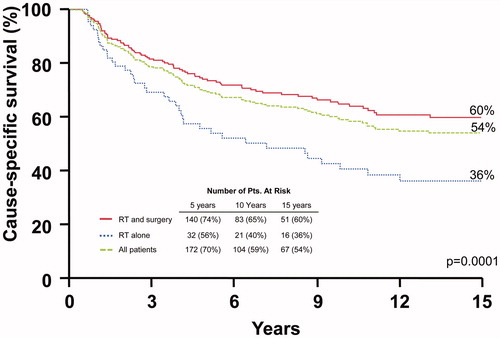
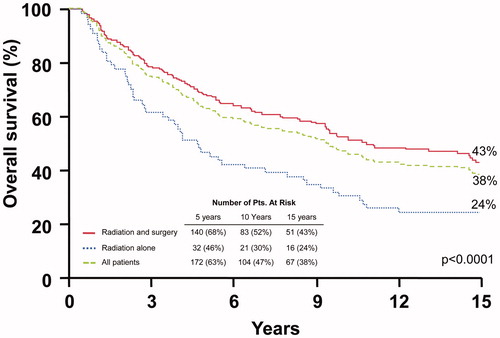
Figure 5. Overall survival rates after surgery and adjuvant radiotherapy (RT), RT alone, and for the overall group.