
Figures & data
Table 1. Patient characteristics treated by nivolumab (n = 58).
Figure 1. Time to treatment failure (a) and overall survival (b) for patients (n = 58) treated with nivolumab in named patient program.
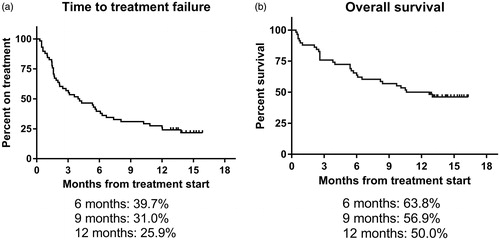
Figure 2. Overall survival for patients with non-squamous carcinoma (n = 34, solid line) or squamous cell carcinoma (n = 24, dotted line).
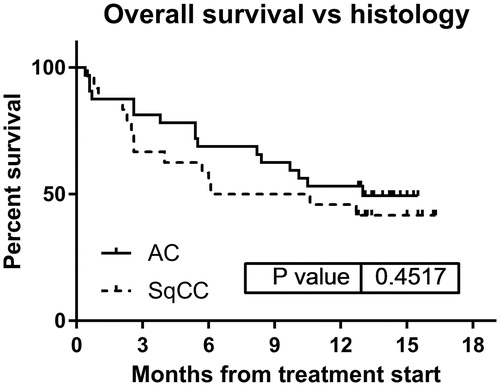
Figure 3. Time (months) from diagnosis to nivolumab treatment start (white), time on nivolumab treatment (black) and post-nivolumab survival time (grey). Each bar represents one patient. Patients still alive are marked with arrow.
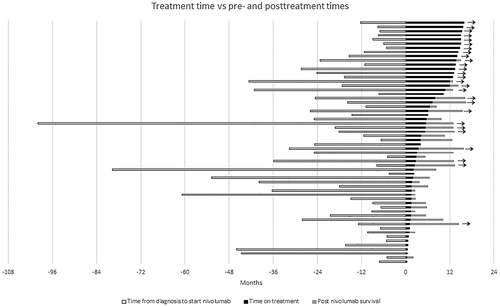
Table 2. Adverse events during nivolumab therapy (n = 58).
Supplemental material