3,736
Views
66
CrossRef citations to date
0
Altmetric
ORIGINAL ARTICLES: PANCREATIC CANCER

Predictors and survival for pathologic tumor response grade in borderline resectable and locally advanced pancreatic cancer treated with induction chemotherapy and neoadjuvant stereotactic body radiotherapy

, , , , , , , , & show all
Pages 391-397 | Received 22 Jun 2016, Accepted 24 Oct 2016, Published online: 25 Nov 2016

Figures & data

Table 1. Patient characteristics, neoadjuvant therapies and pathologic response.

Figure 1. After multi-agent chemotherapy, SBRT and resection of pancreatic adenocarcinoma, progression-free (PFS) and overall survival (OS) are stratified by tumor regression grade (TRG) ((a) and (b), respectively) or pathologic complete response (pCR) versus partial response (pPR) ((c) and (d), respectively). PFS was better for pCR (TRG 0, median PFS not reached) compared to pPR (TRG 1-3, median PFS 13.0 months, p = .033). OS was also better for pCR (no deaths) compared to pPR (median OS 33.9 months, p = .050).

Figure 1. After multi-agent chemotherapy, SBRT and resection of pancreatic adenocarcinoma, progression-free (PFS) and overall survival (OS) are stratified by tumor regression grade (TRG) ((a) and (b), respectively) or pathologic complete response (pCR) versus partial response (pPR) ((c) and (d), respectively). PFS was better for pCR (TRG 0, median PFS not reached) compared to pPR (TRG 1-3, median PFS 13.0 months, p = .033). OS was also better for pCR (no deaths) compared to pPR (median OS 33.9 months, p = .050).

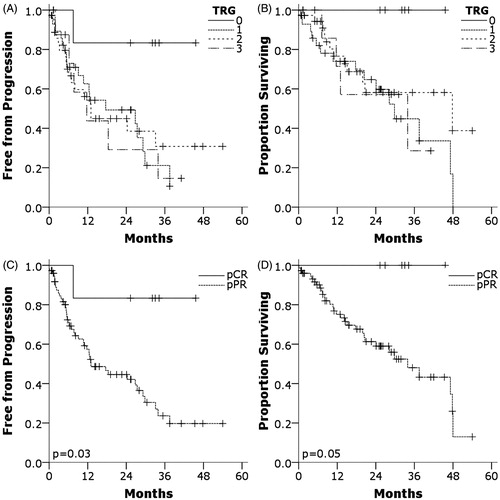
Table 2. CA19-9, SUVmax and RECIST criteria for the 81 analyzed specimens.

Figure 2. Individual data points (circles), medians (diamonds), and 95% confidence intervals (bars) for post-neoadjuvant therapy SUVmax (A), SUVmax percent reduction before and after neoadjuvant therapy (B), post-neoadjuvant therapy CA19-9 (C), and CA19-9 percent reduction before and after neoadjuvant therapy. Significance levels by ordinal logistic regression are given for each plot (p < .05 for A, C, and D, p = .095 for B).

Figure 2. Individual data points (circles), medians (diamonds), and 95% confidence intervals (bars) for post-neoadjuvant therapy SUVmax (A), SUVmax percent reduction before and after neoadjuvant therapy (B), post-neoadjuvant therapy CA19-9 (C), and CA19-9 percent reduction before and after neoadjuvant therapy. Significance levels by ordinal logistic regression are given for each plot (p < .05 for A, C, and D, p = .095 for B).

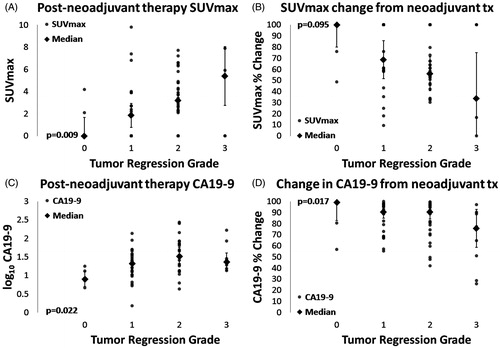
Table 3. Correlations of TRG to CA19-9, SUVmax and RECIST response.

Supplemental material

IONC_1256497_supplementary.docx

Download MS Word (1.6 MB)

Reprints and Corporate Permissions

Please note: Selecting permissions does not provide access to the full text of the article, please see our help page How do I view content?

To request a reprint or corporate permissions for this article, please click on the relevant link below:

Academic Permissions

Please note: Selecting permissions does not provide access to the full text of the article, please see our help page How do I view content?

Obtain permissions instantly via Rightslink by clicking on the button below:

If you are unable to obtain permissions via Rightslink, please complete and submit this Permissions form. For more information, please visit our Permissions help page.