Figures & data
Figure 1. The motion trace describing the respiratory-induced tumor motion in inferior-superior direction for the 10 respiratory phases, as used for the simulated amplitudes. The motion trace is normalized to yield a peak-to-peak amplitude of 1; phase 1: end-inhale, phase 6: end-exhale.
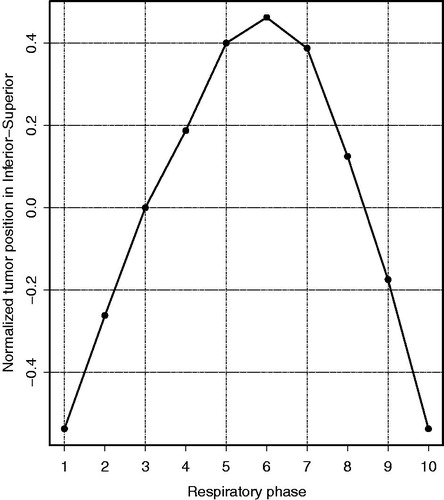
Figure 2. D98% for the CTV as a function of the motion amplitude during treatment delivery simulation, for patient 12 (smallest tumor) and patient 17 (largest tumor), showing the robustness of the RMI treatment plans against daily variations in breathing amplitudes. For example, the solid blue lines represent D98% for various breathing amplitudes for a plan that was optimized for a 5-mm breathing amplitude. The black dashed line represents the required target coverage (D98% = 95%). The lines connecting the data points are a guide to the eye.
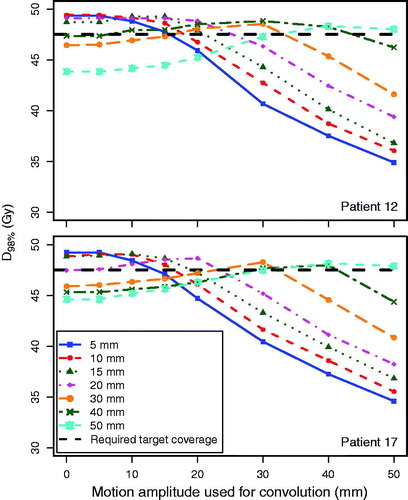
Figure 3. Steepness of the dose gradient in the superior-inferior direction, i.e. distance from the CTV to the 30 Gy isodose line, for the ITV and the RMI approach for the seven simulated respiratory motion amplitudes. Lines are linear fits to the mean values of each approach; error bars indicate the standard deviations over all 18 patients.
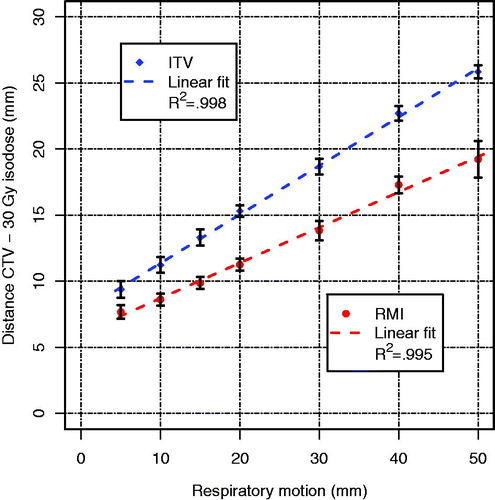
Table 1. Dosimetric parameters for the duodenum for patients 12 and 17, for both the ITV and RMI approach (7 respiratory motion amplitudes each).
Figure 4. Bland-Altman plots for the duodenum, showing for each dosimetric parameter the difference (i.e. ITV value minus RMI value) for all 18 patients. The clinically observed three-dimensional motion amplitudes were used.
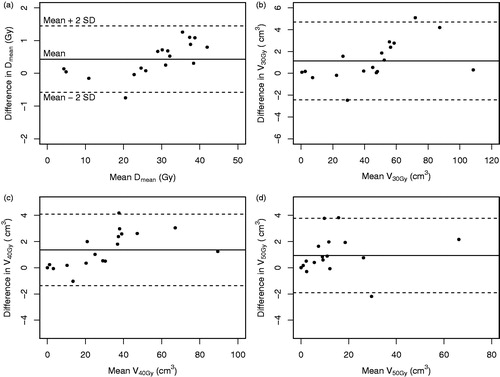
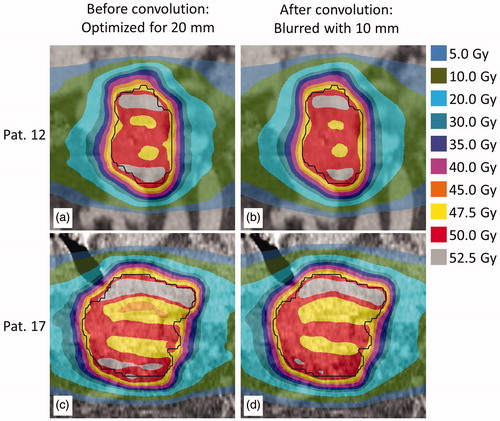
Figure 5. For patients 12 (top) and 17 (bottom), dose distribution optimized for a simulated respiratory amplitude of 20 mm using the RMI approach (a and c) and the same distributions convolved with the PDF describing a simulated respiratory motion amplitude of 10 mm (b and d).