
Figures & data
Figure 1. Description of the study population. Three populations were used for different analysis to maximize the possible number of patients for each analysis (A). The numbers of excluded patients for each analysis are given in the white boxes. The number of patients registered in Stockholm, eligible for resource and comorbidity analyses was evenly distributed throughout the whole study period (B). Patients with either high- or low-grade glioma had excellent coverage in the SBTR (almost 100% for high-grade gliomas, data not shown). Data from all sources were available for all patients between 2001 and 2015, except primary care data, available from 2003 (C).
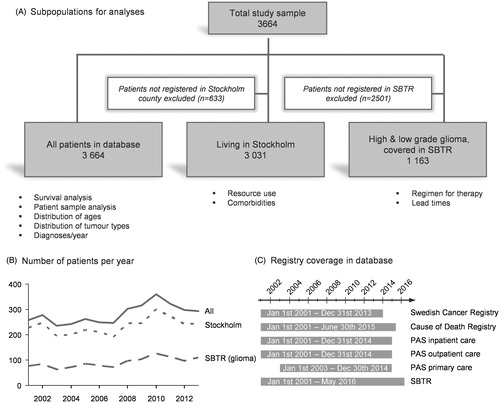
Table 1. Descriptive data for all subpopulations used in analysis.
Table 2. Inpatient days for patients registered in Stockholm (n = 3031) 1 year before and 1 year after diagnosis, and stratified by age, sex, tumor type or comorbidity status.
Figure 2. Survival over time was estimated using Kaplan-Meier analysis. Patients were grouped by (A) tumor type (p < .001), (B–D) year of diagnosis (n.s.), (E) sex and tumor category (p < .001), (D) comorbidity and tumor category (p < .001). Tests of statistical significance of differences between groups were performed using log-rank test for equality of survivor functions.
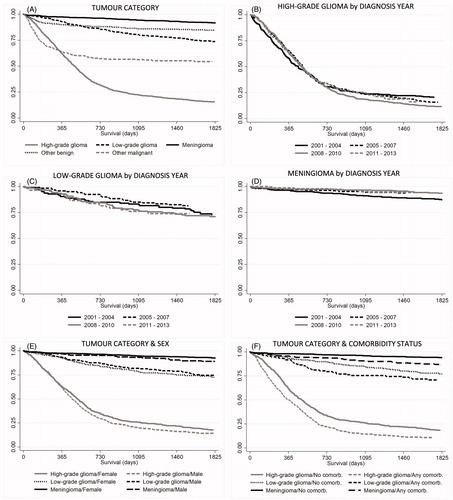
Table 3. Outpatient visits for patients registered in Stockholm (n = 3031) 1 year before and 1 year after diagnosis, and stratified by age, sex, tumor type or comorbidity status.
Table 4. Visits in primary care for patients registered in Stockholm (n = 2362*) 1 year before and 1 year after diagnosis, and stratified by age, sex, tumor type or comorbidity status.
Table 5. Non-surgical cancer treatment. Planned at time of diagnosis and reported at follow-up (12 months after diagnosis).
Table 6. Lead time from diagnosis to surgery with comparison to national guidelines. Patients with high-grade glioma stratified by year of diagnosis, age, sex or comorbidity status.
Table 7. Lead time from surgery to histopathological report with comparison to national guidelines. Patients with high-grade glioma stratified by year of diagnosis, age, sex or comorbidity status.
Table 8. Lead time from surgery to start of non-surgical cancer treatment with comparison to national guidelines. Patients with high-grade glioma stratified by year of diagnosis, age, sex or comorbidity status.