
Figures & data
Table 1. Sociodemographic and clinical characteristics of AYA lymphoma patients compared to normative population.
Figure 1. Comparison of HRQoL (a), long-term symptoms (b) and psychological distress scores (c) between patients and normative population. Note: *p < 0.05 and trivially clinically important difference; **p < 0.05 and small clinically important difference; ***p < 0.05 and medium clinically important difference. (a) Scores can range from 0 to 100 with higher scores implying a better HRQoL. (b) Scores can range from 0 to 100 with higher scores implying more symptoms. (c) Scores can range from 0 to 21 with higher scores implying more psychological distress.
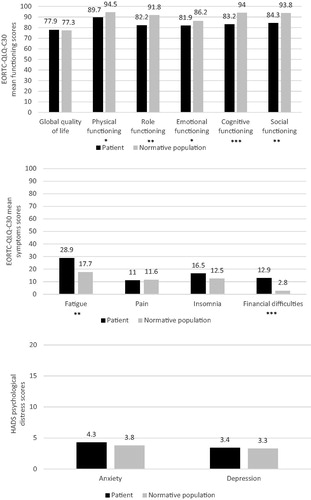
Table 2. Standardized betas of hierarchical multiple linear regression analyses evaluating the association of demographic and clinical characteristics, symptoms and psychological distress with HRQoL among AYA lymphoma patients.