Figures & data
Table 1. Demographic and surgical characteristics of patients.
Table 2. Surgical characteristics and outcomes.
Figure 1. The trajectory of the changes in functional capacity through the perioperative period in the prehabilitation and the control groups. Error bars represent the 95% confidence interval. 6MWD: six-minute walk distance.
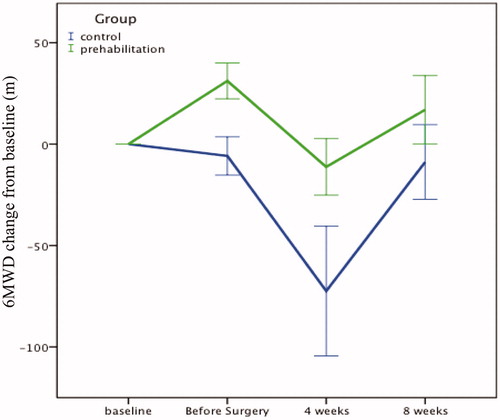
Table 3. Changes in walking capacity through the perioperative period.
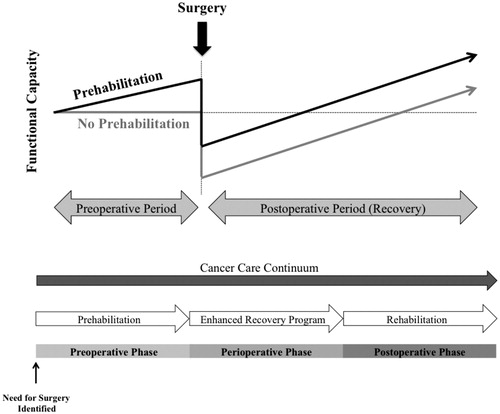
Figure 2. Prehabilitation in a continuum of cancer care.