
Figures & data
Figure 1. Flowchart of patient recruitment.
BC: breast cancer; CRC: colorectal cancer; HNC: head and neck cancer; OC: ovarian cancer.
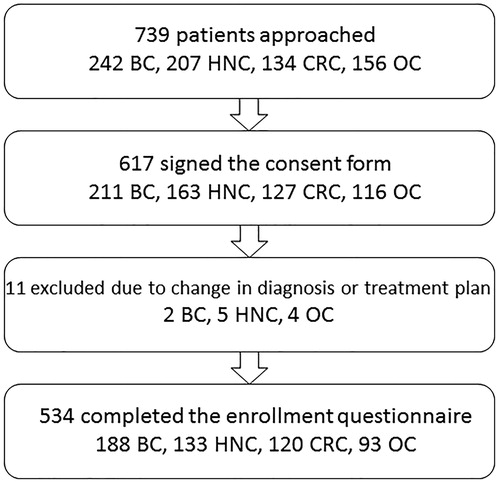
Figure 2. Probability of symptom occurrence for each of the latent classes for the 13 symptoms on the Memorial Symptom Assessment Scale that occurred in ≥30% of the patients.
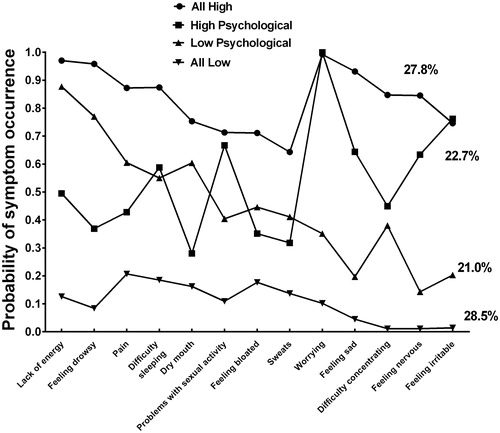
Table 1. Latent class solutions and fit indices for two- through five classes using occurrence rates for 13 symptoms on the Memorial Symptom Assessment Scale.
Table 2. Differences in the occurrence rates for the 13 most common symptoms among the four latent classes (n = 534).
Table 3. Differences in demographic characteristics among the four latent classes (n = 534).
Table 4. Differences in clinical characteristics among the four latent classes (n = 534).
Table 5. Differences in quality of life scores among the four latent classes (n = 534).