
Figures & data
Table 1. Pre-determined constraints on dose-volume parameters for organs at risk and those from treatment plans.
Table 2. Patient characteristics.
Figure 1. Dose distribution in a patient who developed severe cardiac toxicity. Maximal dose, mean dose and V40 of the heart were 57.0 Gy, 41.0 Gy and 60.7%, respectively.
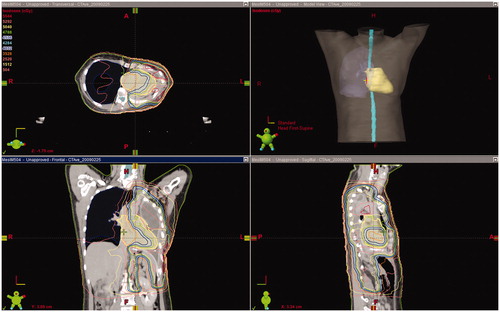
Table 3. Acute and late toxicities grade 2 or worse.
Figure 2. Overall survival since intensity-modulated radiotherapy (IMRT).
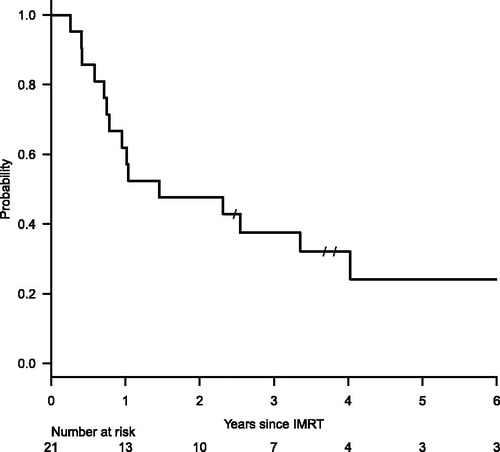
Figure 3. Overall survival according to N-stage.
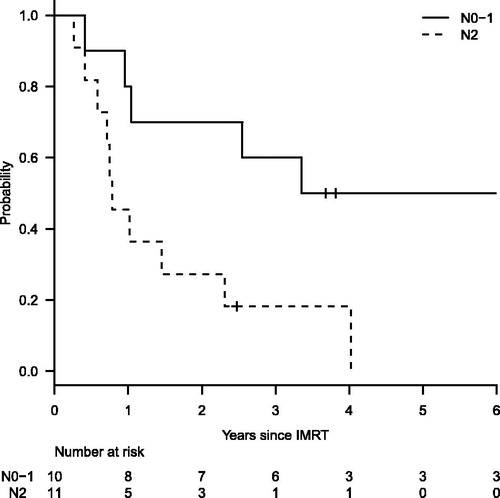
Table 4. Selected series of IMRT following EPP.