Figures & data
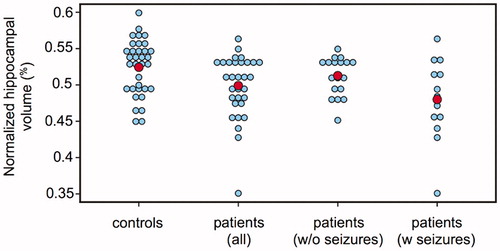
Figure 1. Example of hippocampal segmentations, obtained using Freesurfer. Left and right hippocampi are visualized as contours overlaid over the T1-weighted pre-contrast anatomic image (left) and surface renderings (right).
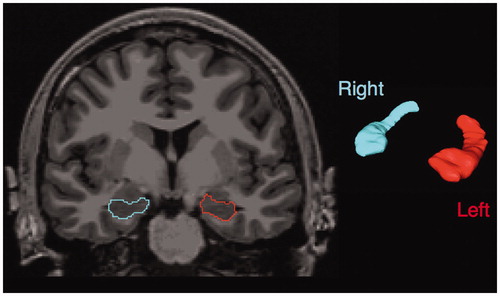
Table 1. Patient and control group characteristics.
Figure 2. Dot plots of normalized hippocampal volume (unitless) in controls, all patients, patients without (w/o) seizures and patients with (w) seizures. The red dots indicate the mean value of the group. Significant differences were found between all patients vs. controls, and patients with seizures vs. controls, but not between patients without seizures vs. controls, or patients with seizures vs. patients without seizures.