
Figures & data
Figure 1. The numbers of newly diagnosed prostate cancer cases by calendar period and stage. All stages (black circles), localized disease (circles), metastasized (triangles), unknown (squares).
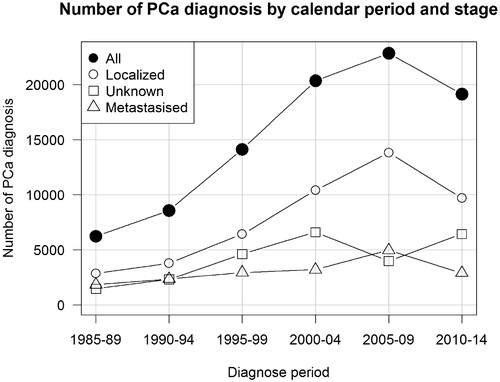
Table 1. Basic characteristics of the study population.
Table 2. SMR by stage and year of diagnosis. Periods 1985–1994 represent the pre-PSA era and periods 1995–2004 the post-PSA era. Follow-up is limited to 10 years.
Figure 2. Relative survival (Relative) and cause-specific survival with respect to PCa (Cancer) and other causes than PCa (Other) of localized and metastasized prostate cancers in pre- (1985–1994) and post- (1995–2004) PSA-testing eras.
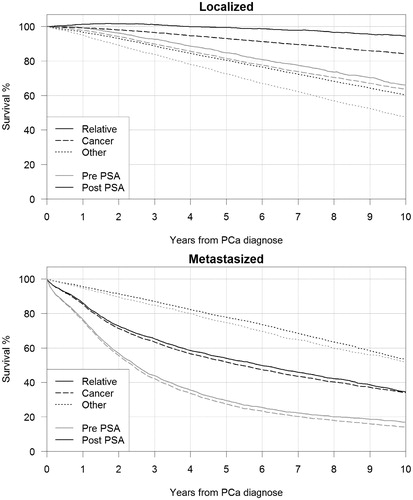
Table 3. Survival estimates for .