Figures & data
Figure 1. Flowchart of patient selection.
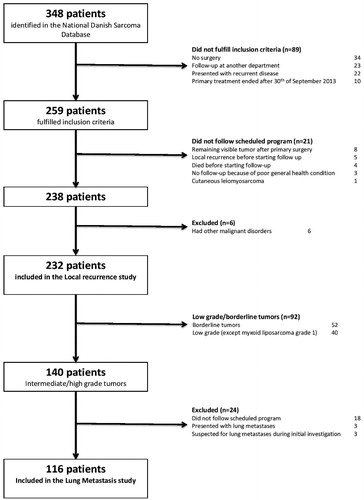
Table 1. Patient demographics – local recurrence.
Table 2. Patient demographic – lung metastasis.
Figure 2. Kaplan–Meier curve showing the cumulated local recurrence free rate (dark grey) and corresponding 95% CI (light grey).
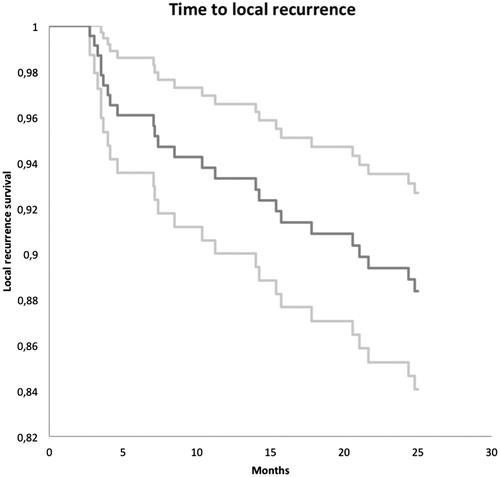
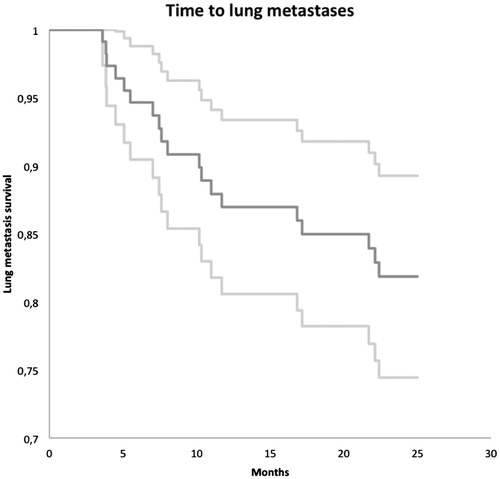
Figure 3. Kaplan–Meier curve showing the cumulated lung metastasis free rate (dark grey) and corresponding 95% CI (light grey).