
Figures & data
Figure 1. Example of a suspicious volume in the right side of the SV found in the T2w image and confirmed by both ADC and Ktrans map. The blue, pink and green contours are the delineated GTVs in the T2w image, the ADC map and the Ktrans map, respectively. The Ktrans map is not calculated in the complete image due to software limitations.
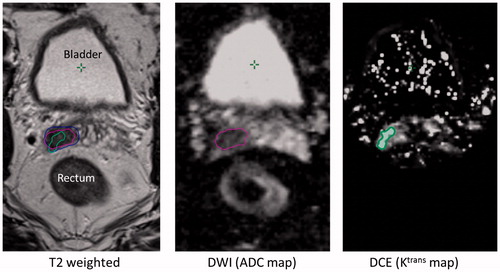
Figure 2. Estimates of the NTCP for rectal toxicity higher than grade 2 (A) and estimated TCP (B). The horizontal axes are the estimates for the plan SV 7 mm. The vertical axes are the estimates of the plan SV 11 mm and MR + 11 mm. See text and supplementary material for details on calculations and plan definitions. Circles and crosses indicate plans for MRI positive and MRI negative patients, respectively. The line of identity is depicted with a slashed line in gray. The rectal NTCP of grade 2 for the SV 7 mm plans were not significantly different from the MR +11 mm plans (p = .76). The TCP for the MR + 11 mm plans were significantly higher compared to the SV 7 and SV 11 mm plans (p ≤ .03)
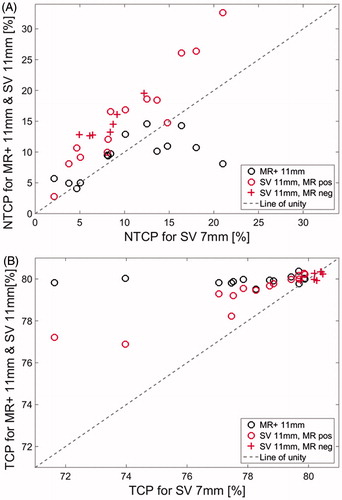
Table 1. Descriptive dose-volume and plan quality metrics for the three plan types. Values are median (range). The ideal CI and HI values were 1 and 0, respectively. Comparing the high dose volumes for MR +11 and SV 7 mm plans no statistical significance was found for rectum (p>.3) but for the bladder the V50Gy was significantly lower for the MR +11 mm plan (p=.0001). The first three columns are data from MRI positive patients and the last three columns are from MRI negative patients.