Figures & data
Figure 1. Example slices of GTV delineated on 3DCT + MRI (a) or 3DCT-only [Citation12] (b) and iGTV delineated on the Ave-IP using 4DCT + MRI (c) or 4DCT-only [Citation12] (d). The MRI images (e–h) show the manually selected corresponding slice. The apparent diffusion coefficient map from the DWI acquisition is shown (h). T1W: T1-weighted; GE: gradient echo; CE: contrast enhanced; T2W: T2-weighted; TSE: turbo spin echo; DWI: diffusion-weighted imaging.
![Figure 1. Example slices of GTV delineated on 3DCT + MRI (a) or 3DCT-only [Citation12] (b) and iGTV delineated on the Ave-IP using 4DCT + MRI (c) or 4DCT-only [Citation12] (d). The MRI images (e–h) show the manually selected corresponding slice. The apparent diffusion coefficient map from the DWI acquisition is shown (h). T1W: T1-weighted; GE: gradient echo; CE: contrast enhanced; T2W: T2-weighted; TSE: turbo spin echo; DWI: diffusion-weighted imaging.](/cms/asset/a65e5f39-f237-42f7-b37d-2be5bd38dba7/ionc_a_1304654_f0001_c.jpg)
Table 1. Overview of the images.
Table 2. Average volume, CIgen, and overall observer variation.
Figure 2. Scatter plots of the volume of the delineated iGTV on 3DCT + MRI (a), 4DCT + MRI (b), 3DCT-only (c) and 4DCT-only (d) per patient per observer. Median and interquartile ranges are indicated. Observer colors in the online article correspond to Figure 1(a–d). Graphs (c) and (d) are from Versteijne et al. [Citation12].
![Figure 2. Scatter plots of the volume of the delineated iGTV on 3DCT + MRI (a), 4DCT + MRI (b), 3DCT-only (c) and 4DCT-only (d) per patient per observer. Median and interquartile ranges are indicated. Observer colors in the online article correspond to Figure 1(a–d). Graphs (c) and (d) are from Versteijne et al. [Citation12].](/cms/asset/b0a5365a-311a-4408-a8c9-25896cc12ecb/ionc_a_1304654_f0002_c.jpg)
Figure 3. The local observer variation (local SD) projected on the median surfaces of the iGTV for 3DCT + MRI (a), 3DCT-only (b), 4DCT + MRI (c) and 4DCT-only (d). Colors correlate to the local SD, with white (online: red) indicating local SD ≥9.4 mm. Volumes are viewed posterior of the patient (dummy). Note that for patient 2, the portocaval lymph node was included in b–d. Figures b and d are from Versteijne et al. [Citation12].
![Figure 3. The local observer variation (local SD) projected on the median surfaces of the iGTV for 3DCT + MRI (a), 3DCT-only (b), 4DCT + MRI (c) and 4DCT-only (d). Colors correlate to the local SD, with white (online: red) indicating local SD ≥9.4 mm. Volumes are viewed posterior of the patient (dummy). Note that for patient 2, the portocaval lymph node was included in b–d. Figures b and d are from Versteijne et al. [Citation12].](/cms/asset/3c2de50b-4e2d-4ec7-9eae-c02c86fb174d/ionc_a_1304654_f0003_c.jpg)
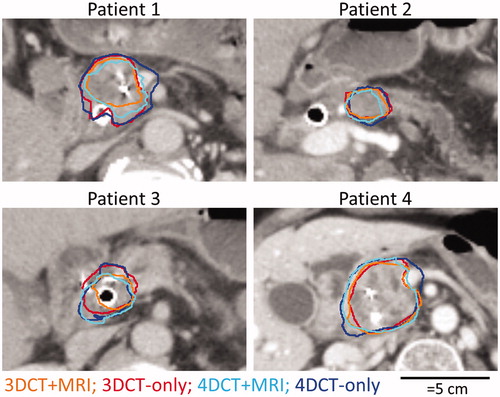
Figure 4. For each patient, median surfaces for CT + MRI study (orange and light blue in the online version) and the CT-only study (red and dark blue in the online version) are shown.