
Figures & data
Table 1. Clinical and laboratory characteristics of the study patients (n = 132).
Figure 1. Distribution of preoperative serum ionized calcium and parathyroid hormone concentrations in subgroups of parathyroid carcinoma (1), atypical adenoma (2) and benign adenoma (3).
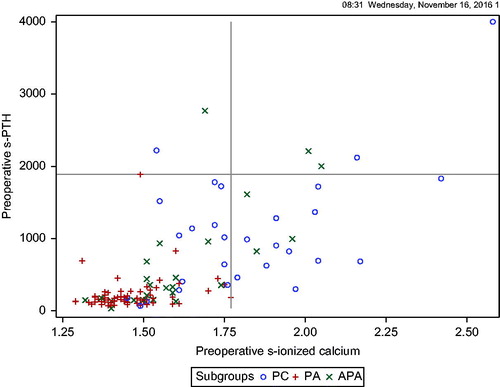
Figure 2. Diagnostic (A–B) and typical (C–F) findings in parathyroid carcinoma. A: Infiltrative growth to adipose tissue, B: Vascular invasion, C: Diffuse growth pattern, and 100% chief cells, D: Nuclear atypia, E: Fibrous bands and hemosiderin, F: Necrosis.
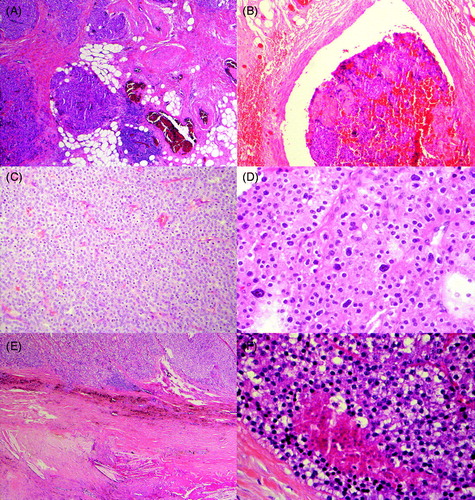
Table 2. Histopathological findings in the different subgroups.
Figure 3. Parafibromin stain in parathyroid carcinomas (A negative and B positive). Digital images of Ki-67 staining in Tissue Micro Array in a parathyroid adenoma with a low PI (C) and in an aggressive parathyroid carcinoma with high PI (D). The corresponding pseudocolor image of Immunoratio-program respectively with low PI (E) and high PI (F).
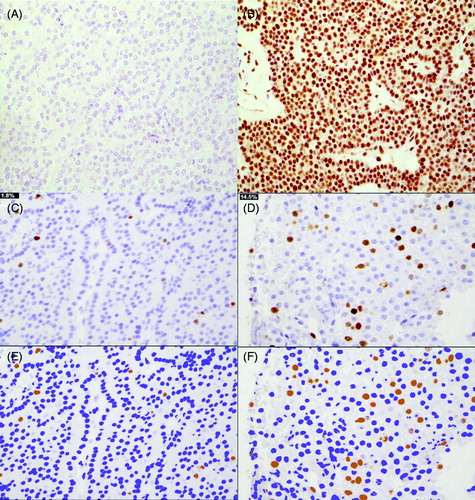
Table 3. Parafibromin and Ki-67 proliferation indices and germ-line CDC73 mutation status in the different subgroups.
Figure 4. Survival analysis in parathyroid carcinoma, atypical adenoma and parathyroid adenoma. 5-year and 10-year survivals are 90.6 and 71.9% for PC, 83.9 and 73.4% for APA, and 91.7 and 82.5% for PA (p = NS).
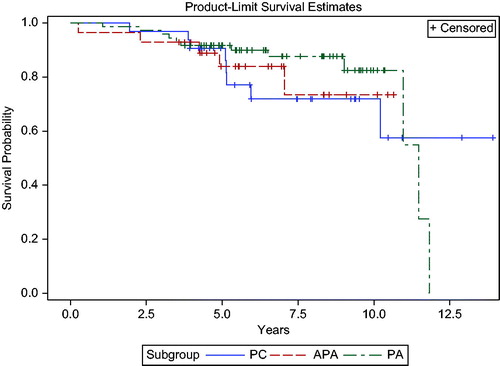
Figure 5. Incidence of parathyroid carcinoma in Finland (per 10,000,000/year).
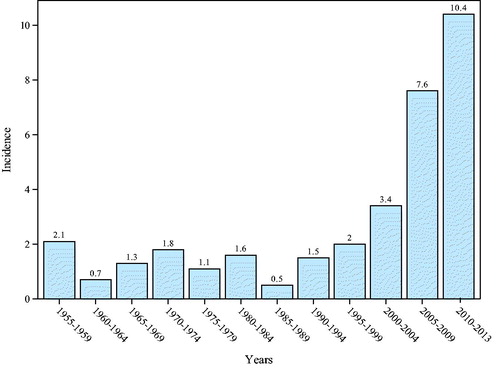
Table 4. Recurrences, treatments and survival in the different subgroups.
Table 5. Clinical, biochemical and histological findings in patients with recurrent vs cured parathyroid carcinoma (PC).