907
Views
5
CrossRef citations to date
0
Altmetric
LETTERS TO THE EDITOR

Radiation physiology – evidence for a higher biological effect of 24 Gy in four fractions as compared to three

ORCID Icon, , , , , , , , & show all
Pages 1240-1243 | Received 18 Jan 2017, Accepted 13 Mar 2017, Published online: 05 Apr 2017

Figures & data

Figure 1. (A) The number of degenerating crypts in six analyzed colorectal circumferences per subject in the 6 Gy cohort. (B) The number of degenerating crypts in six analyzed colorectal circumferences per subject in the 8 Gy cohort. (C) Mucosa stained with Nuclear Fast Red for nuclei, and Alcian Blue for goblet cells six weeks after four fractions of 8 Gy. A degenerating crypt, depicted with an asterisk, is flanked by seemingly healthy crypts (arrow). (D) A magnification of the degenerating crypt in (C), showing a top-to-bottom degenerative progress, as the crypt wall and a few goblet cells are still visible at the base of the crypt (arrow). (E) DAB-stain of ki67-positive proliferating cells. No labeled cells are visible in the degenerated crypt (asterisk), while multiple darkly stained ki67-positive nuclei are visible in a nearby crypt (arrows). Data presented as number of degenerating crypts in six circumferences per subject ± SEM: 6 Gy cohort; SHAM-IRR = 0.00 ± 0.00, IRR 2 × 6 Gy = 0.00 ± 0.00, IRR 3 × 6 Gy = 0.5 ± 0.33, IRR 4 × 6 Gy = 5.5 ± 1.24. 8 Gy cohort; SHAM-IRR = 0.00 ± 0.00, IRR 2 × 8 Gy = 0.71 ± 0.36, IRR 3 × 8Gy = 0.63 ± 0.42, IRR 4 × 8 Gy = 11.3 ± 2.09. Statistical analysis was performed using the nonparametric Kruskal–Wallis. Scale bar = 50 μm.

Figure 1. (A) The number of degenerating crypts in six analyzed colorectal circumferences per subject in the 6 Gy cohort. (B) The number of degenerating crypts in six analyzed colorectal circumferences per subject in the 8 Gy cohort. (C) Mucosa stained with Nuclear Fast Red for nuclei, and Alcian Blue for goblet cells six weeks after four fractions of 8 Gy. A degenerating crypt, depicted with an asterisk, is flanked by seemingly healthy crypts (arrow). (D) A magnification of the degenerating crypt in (C), showing a top-to-bottom degenerative progress, as the crypt wall and a few goblet cells are still visible at the base of the crypt (arrow). (E) DAB-stain of ki67-positive proliferating cells. No labeled cells are visible in the degenerated crypt (asterisk), while multiple darkly stained ki67-positive nuclei are visible in a nearby crypt (arrows). Data presented as number of degenerating crypts in six circumferences per subject ± SEM: 6 Gy cohort; SHAM-IRR = 0.00 ± 0.00, IRR 2 × 6 Gy = 0.00 ± 0.00, IRR 3 × 6 Gy = 0.5 ± 0.33, IRR 4 × 6 Gy = 5.5 ± 1.24. 8 Gy cohort; SHAM-IRR = 0.00 ± 0.00, IRR 2 × 8 Gy = 0.71 ± 0.36, IRR 3 × 8Gy = 0.63 ± 0.42, IRR 4 × 8 Gy = 11.3 ± 2.09. Statistical analysis was performed using the nonparametric Kruskal–Wallis. Scale bar = 50 μm.

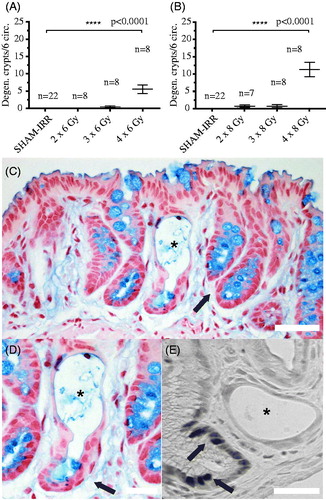
Table 1. Biological effective doses (BED) and physical doses for different fractionation schedules.

Reprints and Corporate Permissions

Please note: Selecting permissions does not provide access to the full text of the article, please see our help page How do I view content?

To request a reprint or corporate permissions for this article, please click on the relevant link below:

Academic Permissions

Please note: Selecting permissions does not provide access to the full text of the article, please see our help page How do I view content?

Obtain permissions instantly via Rightslink by clicking on the button below:

If you are unable to obtain permissions via Rightslink, please complete and submit this Permissions form. For more information, please visit our Permissions help page.