
Figures & data
Figure 1. Subgroup analysis flow chart.
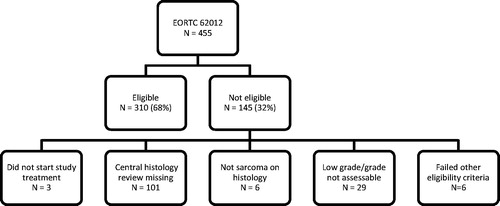
Table 1. Patient characteristics.
Table 2. Prognostic factors for best overall response (CR + PR): multivariate analysis stratified by treatment.
Table 3. Prognostic factor analysis for OS: multivariate analysis stratified by treatment.
Figure 2. Interaction of histological subtype with treatment on OS (A: central pathology review; B: local pathology review).
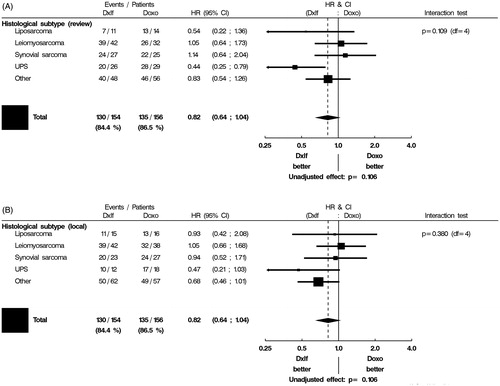
Table 4. Interaction of histological subtype on response to treatment (A: local pathology assessment; B: central pathology assessment).