Figures & data
Figure 1. Standard deviation of WEPL over the difference of all rCTs to the pCT for each mean over BEV ray path (to the right section of the lymph nodes) map in every 5° in a semicircle on the axial plane (couch =0°) on the right side of the patients. The upper plot is all the individual patients numbered 1->16; the lower plot is the mean and standard deviation across all the patients for each angle.
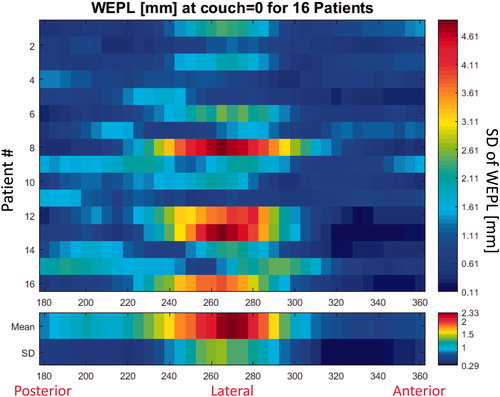
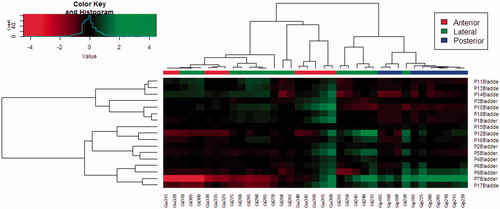
Figure 2. Cluster comparison plot for the log2 normalized mean WEPL deviation to the right section of the LNs. A higher “Value” corresponds to a higher WEPL variation (top left). Correlating patients (rows) against angles (columns). The branch length corresponds to the Pearson distance between rows and columns.
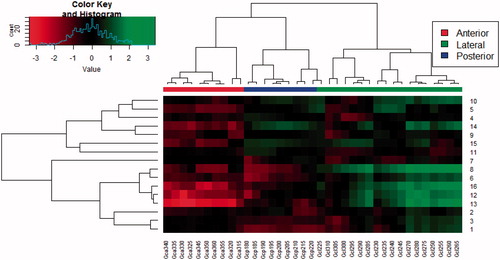
Figure 3. Polar-plot of mean dose to the LNs (red), Rectum (blue), Bladder (purple), and bowel (green). The gantry angle corresponds to the angular axis only treating from ipsi-lateral angles, meaning the left section of the LNs is treated for 0°–180° and the right section for 180°–360°, the radius corresponds to the mean dose (percent of prescribed dose). All pCTs and rCTs of all patients are plotted on top of each other in the first and third column, the second column, and fourth column only use two rCTs per patient. The two left columns are using a 3 mm isotropic margin, the two right columns using a 5 mm margin.
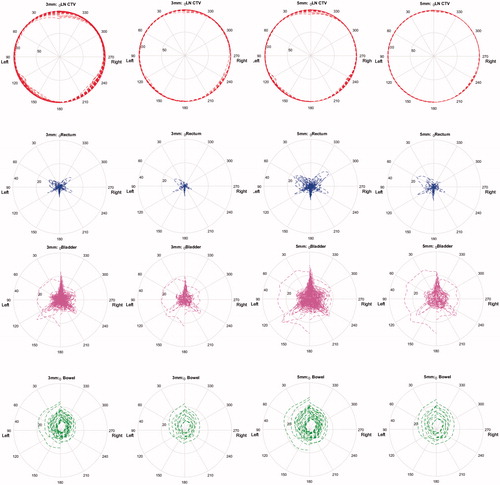
Figure 4. Cluster comparison plot for the log2 normalized mean dose to the bladder when treating the right section of the LNs with a 5 mm isotropic margin. A higher “Value” corresponds to a higher mean dose variation (top left). Correlating patients (rows) against angles (columns). The branch length corresponds to the Pearson distance between rows and columns respectively (one patient was excluded, due to outliers disturbing the visibility).