
Figures & data
Table 1. Patient and tumor characteristics.
Figure 1. Frequency of the follow-up reports.
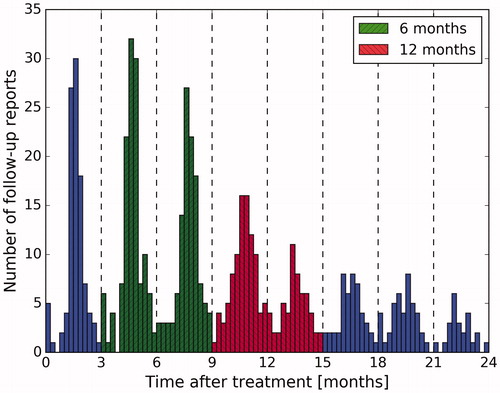
Figure 2. Scatterplot of mean doses to parotid glands and corresponding xerostomia grades at 12 months after the treatment.
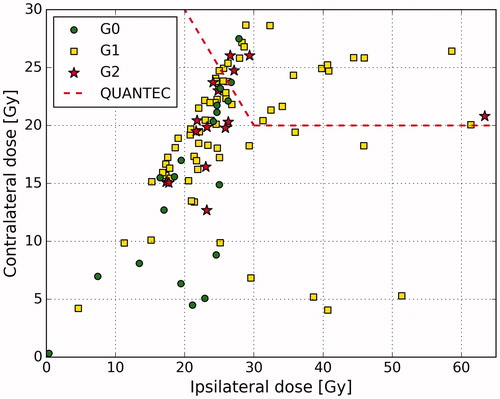
Table 2. Variability of xerostomia grades.
Figure 3. Comparison of parotid glands mean dose distributions between our (HD) and the PARPSORT (PAR) data sets. Outliers, that is, observations further than 1.5 interquartile range (IQR) from the first or the third quartile, are marked with ‘+’.
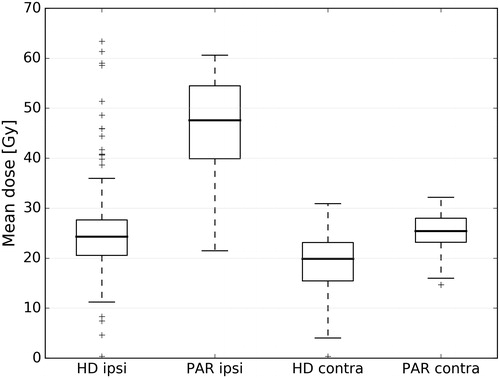
Figure 4. NTCP function for G2 + xerostomia at 12 months based on the data from the PARSPORT clinical trial ([Citation19]) with observations from our cohort.
![Figure 4. NTCP function for G2 + xerostomia at 12 months based on the data from the PARSPORT clinical trial ([Citation19]) with observations from our cohort.](/cms/asset/29075b51-707c-4651-88c4-06fc1edcff44/ionc_a_1324209_f0004_c.jpg)
Figure 5. NTCP and performance curves for G1 + xerostomia. (a) NTCP functions at 6 months, (b) NTCP functions at 12 months, (c) ROC curves at 6 months, (d) ROC curves at 12 months, (e) Precision-recall curves at 6 months, (f) Precision-recall curves at 12 months.
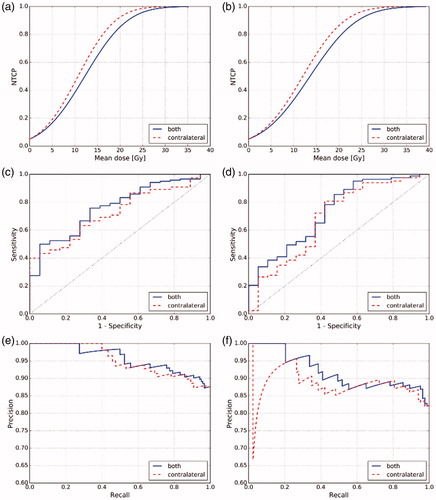
Table 3. The parameters and performance of the LKB models with 95% confidence intervals.
Table A1. Confusion matrix.