
Figures & data
Figure 1. The study design in the present study compared with the design of previous studies.
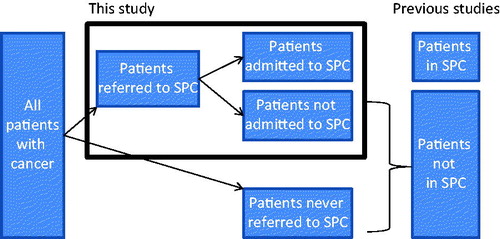
Table 1. Comparison of EAPC recommendations with regard to the number of SPC beds and teams versus the number in Denmark (2012).
Table 2. Characteristics of the study population.
Figure 2. Flow chart of the patients referred to SPC in 2010–2012 and included in the study population.
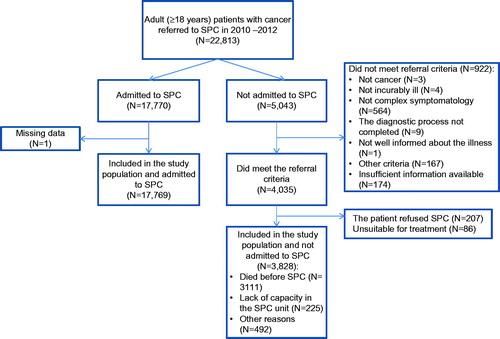
Table 3. Admittance to SPC of Danish cancer patients with an assessed need for SPC in relation to sex, age, region, diagnosis, referral unit and time from referral to death (N = 21,597).
Table 4. Mean and median time from referral to SPC to death based on sex and referral unit (N = 21,597).