
Figures & data
Table 1. Summary of costs and population level measures (nominal prices) for 2004 and 2014 in Finland.
Figure 1. The deflated costs of cancer by cost drivers for 2004, 2009 and 2014, 2004 = 100.
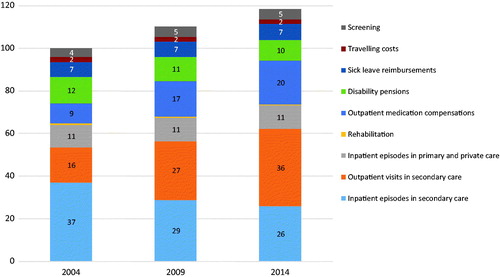
Figure 2. Actual nominal costs compared to the national estimates made in 2006 [Citation8].
![Figure 2. Actual nominal costs compared to the national estimates made in 2006 [Citation8].](/cms/asset/b5e3596a-501c-4dab-8e78-2d11daacda08/ionc_a_1343495_f0002_c.jpg)
Figure 3. The costs of cancer and the outcome measures of care for 2004, 2009 and 2014. 2004 = 1. *Survival ratio year means the observation year.
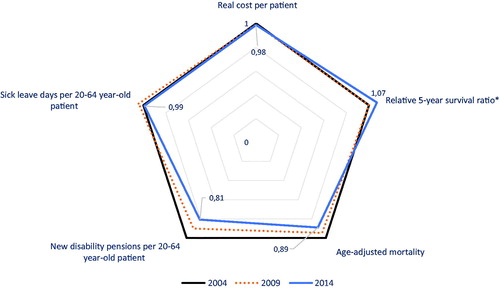
Table 2. Summary of cost trends in previous studies of cost of cancer and the results of this study.