Figures & data
Table 1. Detailed patients characteristic.
Table 2. The scanning parameters for training and validation cohorts and two image modalities.
Figure 1. Radiomics-based local tumor control prognostic models: (a) CT-based radiomics, (b) PET-based radiomics, (c) CT- and PET-based radiomics. Tumor control curves split significantly (G-rho test p-value < 0.05) in both training and validation cohorts based on the optimal sensitivity-specificity thresholds at 18 months.
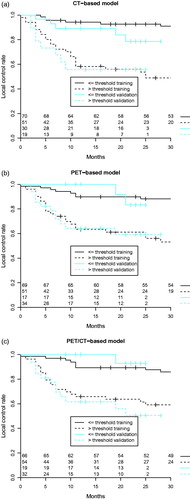
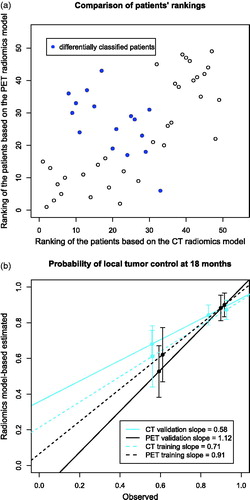
Figure 2. The comparison of risk group stratification in the validation cohort by CT- and PET-based radiomics models (a) the repeatability of patients’ ranking based on CT and PET radiomics models and differences in risk group stratification, (b) the relation between observed and radiomics model-based estimated probabilities of local tumor control at 18 months for risk groups defined using the radiomics models.