Figures & data
Figure 1. (A) Heatmap of the image parameters of the baseline scan ranked in descending order according to the quality score of the hospital. (B) Heatmap of the difference in image parameters between the baseline scan and the response scan ranked in descending order according to the quality score of the hospital. Green: EANM guideline compliant, white: missing information, orange: improved for response scan, red: EANM guideline non-compliant/worsened for response scan, striped: response scan on different scanner than baseline scan.
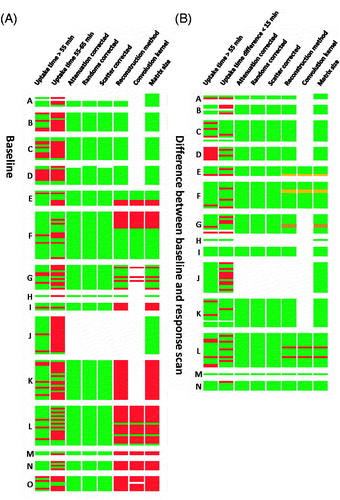
Figure 2. Time interval between injection and start time of scan per patient ranked in ascending order for the baseline scan. The horizontal lines show the NEDPAS specified maximum (65) and minimal (55) uptake times. One outlier (106; 251) is removed for visualization purposes.
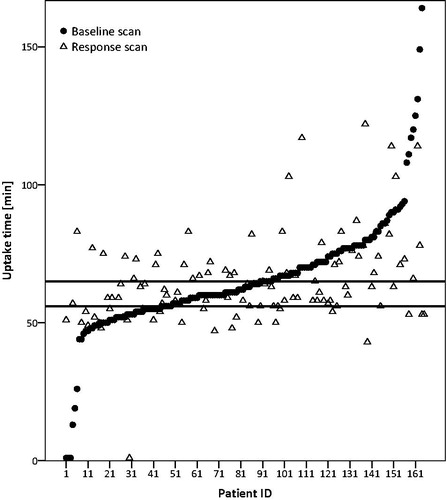
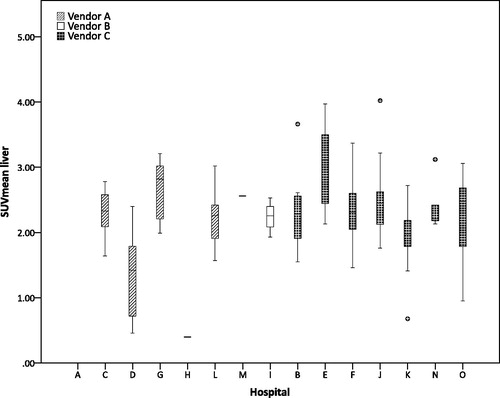
Figure 3. Boxplot of SUVmean of the liver of the baseline scan ranked in descending order according to the quality score and per vendor, the scans of hospital A were, due to a missing SUV conversion tag, not converted to SUV and are therefore empty in the graph.