Figures & data
Figure 1. The effect of CA4P (250 mg/kg) on the radiation response of tumors and normal skin. Full radiation dose–response curves were produced and show the percentage of animals with local tumor control at 90 days after treating a C3H mammary carcinoma (left panel) or developing moist desquamation between days 11 and 30 in normal foot skin (right panel). For both tumor and skin, the symbols are for radiation alone (^) or radiation + CA4P (•), based on an average of 14 mice/group for tumor and six mice/group for skin. Lines through the data were fitted following logit analysis.
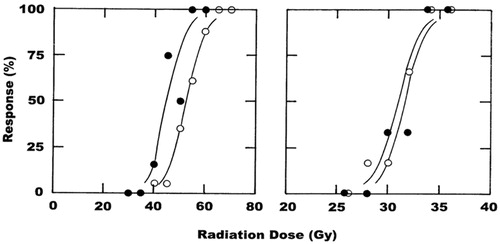
Table 1. Summary effects of radiation and CA4P in tumors and normal tissues.
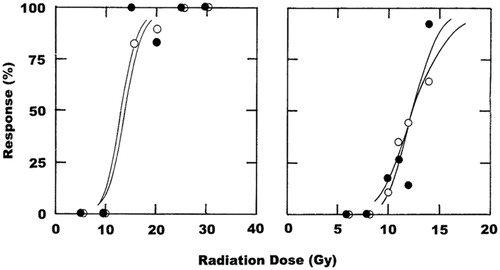
Figure 2. The effect of CA4P (250 mg/kg) on the radiation response of normal bladder and lung. Full radiation dose–response curves were produced and show the percentage of animals that up to 9 months after treatment have either a 50% reduction in bladder reservoir function estimated by cystometry (left panel), or a 20% increase in lung ventilation rate measured by plethysmography (right panel). For both bladder and lung, the symbols are for radiation alone (^) or radiation + CA4P (•), based on an average of seven mice/group for bladder and 16 mice/group for lung. Lines through the data were fitted following logit analysis.