
Figures & data
Table 1. Patient characteristics.
Figure 1. Box plots show the lower, upper quartile and the median line of the differences in dose metrics between the original plan on pCT and recalculation on the re-CT. The mean is indicated with ‘x’.
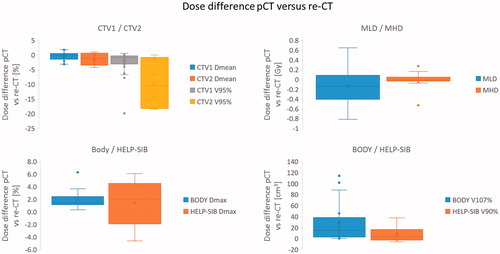
Figure 2. Example of a patient (PlanID 4) treated with a homogeneous dose to the right breast (16 x 2.66Gy) after surgical lumpectomy. Visualized are the original plan on the pCT, the adapted (new) plan on the re-CT and a re-calculation of the dose using the original plan on the re-CT, respectively. Notice the reduction in seroma on re-CT imaging, which was the reason for re-planning.
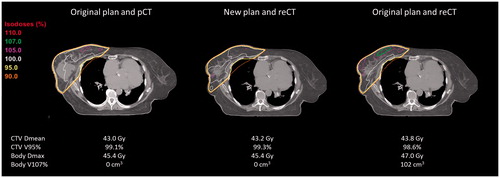
Table 2. The evaluated DVH parameters for the original plan on the pCT or re-CT, including the dosimetric differences.
Figure 3. Example of a patient (PlanID 13) treated with a homogeneous dose to the left breast and axilla level 3 + 4 (16 x 2.66Gy) after lymph node dissection of an unknown primary lesion. Visualized are the original plan on the pCT, the re-calculation of the dose on the re-CT and stitched CBCT, respectively.
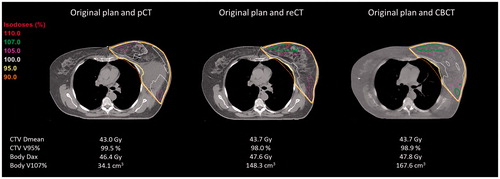
Figure 4. Visualized are the dose differences in DVH parameters. (i) Between the original plan on pCT and recalculation on the re-CT and (ii) between the original plan on pCT and re-calculation on the stitched CBCT, respectively. DVH thresholds for adaptation are marked in red. Dose differences are similar between reCT and CBCT imaging; the Wilcoxon signed rank test was non-significant for all parameters.
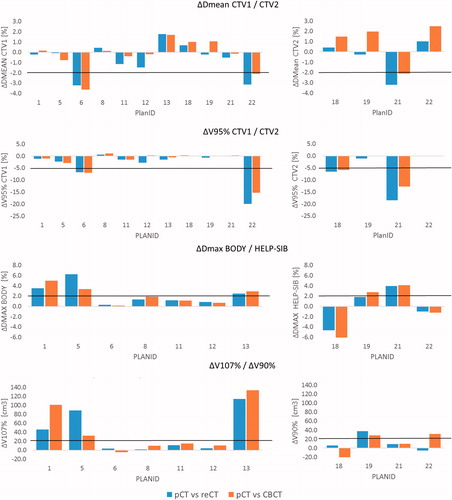
Table 3. Overview of the clinical and DVH evaluation for adaptive treatment.