Figures & data
Figure 1. Dose–response effects of VDAs. (A) Relative necrosis that develops 24 hours after VDA treatment. (B) The time taken in days for tumors to reach five times the treatment volume of 200 mm3 (TGT5). Results for both necrosis and TGT5 are from an average of six animals. Data points are indicated as mean ± SE.
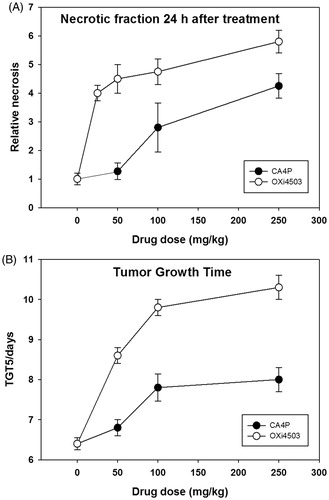
Table 1. Histologic vascular parameters in control and VDA-treated animals measured at 3 h (CA4P) or 6 h (OXi4503) after treatment. Results are means (±SE) and the number of animals per group is 5–6; measurements were made on the same animals as used for the HPMRS study.
Figure 2. (A) Representative 13C spectra of a C3H mammary carcinoma, showing from left: lactate, pyruvate-hydrate, alanine, signal impurity, pyruvate, urea and bicarbonate. (B): Time evolution of the hyperpolarized [1-13C]pyruvate and [1-13C]lactate, showing the delayed conversion of lactate compared to pyruvate. (C) Relative change (normalized to control animals) in the pyruvate/lactate ratio measured using HPMRS either 3 h (CA4P) or 6 h (OXi4503) after treatment. (D) As in (C) but for the lactate/bicarbonate ratio. (E) As in (C) but for the bicarbonate/pyruvate ratio. (F) Relative change in the IAUC measured using DCE-MRI either 3 h (CA4P) or 6 h (OXi4503) after treatment. Results shown in C–F are means (±1 SE). Treated animals were compared to control animals using a one-way ANOVA followed by a Holm-Sidak test. *Changes significantly different from control (p < .05). Experiments involving different scanner technologies were conducted on separate cohorts of animals. The CA4P DCE-MRI data are from a previous publication (Nielsen et al., 2008, Int J Radiat Oncol Biol Phys. 70:859–866).
![Figure 2. (A) Representative 13C spectra of a C3H mammary carcinoma, showing from left: lactate, pyruvate-hydrate, alanine, signal impurity, pyruvate, urea and bicarbonate. (B): Time evolution of the hyperpolarized [1-13C]pyruvate and [1-13C]lactate, showing the delayed conversion of lactate compared to pyruvate. (C) Relative change (normalized to control animals) in the pyruvate/lactate ratio measured using HPMRS either 3 h (CA4P) or 6 h (OXi4503) after treatment. (D) As in (C) but for the lactate/bicarbonate ratio. (E) As in (C) but for the bicarbonate/pyruvate ratio. (F) Relative change in the IAUC measured using DCE-MRI either 3 h (CA4P) or 6 h (OXi4503) after treatment. Results shown in C–F are means (±1 SE). Treated animals were compared to control animals using a one-way ANOVA followed by a Holm-Sidak test. *Changes significantly different from control (p < .05). Experiments involving different scanner technologies were conducted on separate cohorts of animals. The CA4P DCE-MRI data are from a previous publication (Nielsen et al., 2008, Int J Radiat Oncol Biol Phys. 70:859–866).](/cms/asset/ddd03a47-2702-4e7f-978d-0cc6fe3a6ff4/ionc_a_1351622_f0002_c.jpg)
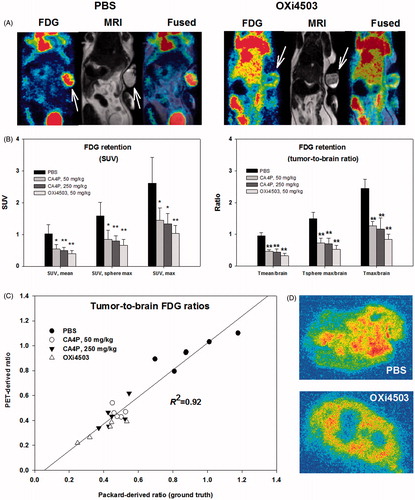
Figure 3. FDG-PET as a means to visualize and quantify early metabolic changes during VDA treatment. (A) FDG-PET/MRI images showing a PBS treated (control) and an OXi4503 treated tumor-bearing mice. Arrows indicate tumor location. (B) Bar charts show summarized data for all treatments using SUV or reference-tissue-based quantification of whole-tumor average or tumor sub-volume glucose metabolism. Mean values ± SD are plotted. Treated animals were compared to control animals using a one-way ANOVA followed by Tukey’s test. Values significantly different from controls are indicated by *p < .05, **p < .001. (C) Scatterplot showing the close relationship between PET-derived and gamma counter derived (ground truth) whole-tumor to whole-brain tracer ratios. (D) Examples of high-resolution invasive analysis of the intratumoral distribution of FDG retention.