Figures & data
Figure 1. Schematic figure of the used setup for dual-energy proton radiography imaging in both imaging modes. The blue arrow on the left indicates the incident proton field. In absorption mode, the measured dose distribution encodes the residual energy of the beam after passing the object and hence the combined thickness of the plates and the object. In scattering mode, the fluence of the field is disturbed by the passage of the beam through regions of different density (here depicted as different shades of grey). The distance d between object and detector remains unchanged.
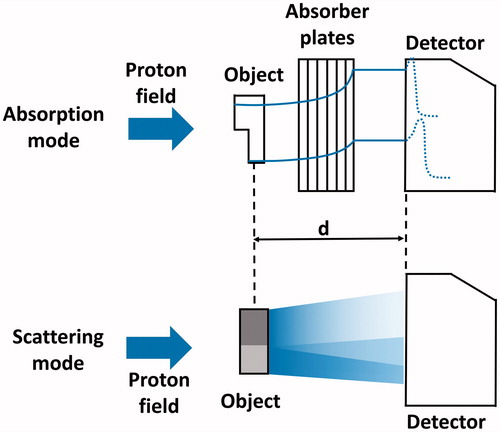
Figure 2. Raw scattering mode proton radiography image of a mouse (a) within the bedding unit (b). The edge of the brass collimator which shapes the extended proton field (c) can be visually identified by the bright corona (d) at its edges.
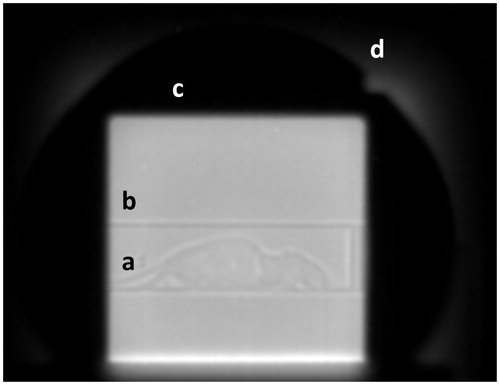
Figure 3. (A) Proton radiography image acquired in scattering mode. (B) Planar X-ray scan of the same mouse prior to proton radiography acquisition. Both images were cropped with the bedding unit used as landmark. The markers indicate the contours of internal and external structures of the mouse that could be identified in the planar X-ray image. Structures that could be distinguished were (a) abdominal intestines, (b) the stomach, (c) the lung, (d) the vertebral spine and (e) the body contour of the mouse. These contours are also shown in the proton radiography image (A) for illustration.
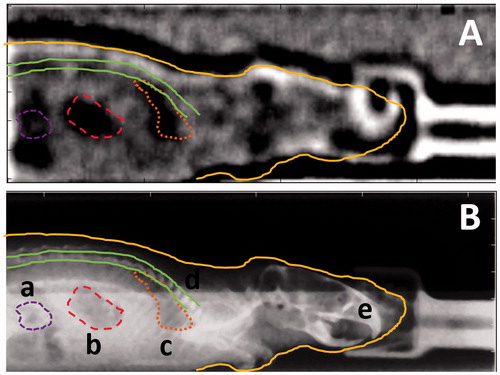
Figure 4. Absorption mode proton radiography. (A) Raw image and (B) background-corrected image with conversion from pixel value/MU to WEPL applied. (C) Post-processed image using an unsharp masking filter for the enhancement of internal structures.
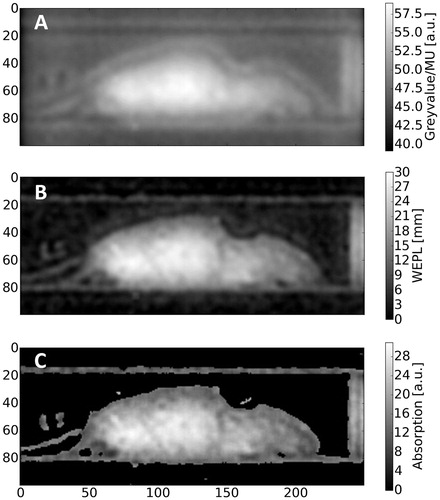
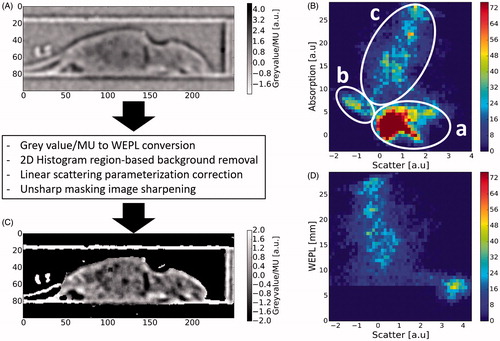
Figure 5. Overview of applied data processing and post-processing operations. (A) Background-corrected scattering mode image S. (B) Native 2D histogram of pixel values from background-corrected images in scattering and absorption mode along the x and y axis, respectively. The highlighted regions could be assigned to specific image features such as (c) the body of the mouse, (b) the bedding unit and (a) the air-filled image background. (C) Processed scattering mode image and (D) corresponding modified 2D histogram after the applied operations (for details see Material and methods).