
Figures & data
Figure 1. Kaplan-Meier survival curves (with 95% CI and p-values from the log-rank test) on outcome based on the GTV-T shrinkage gradient.
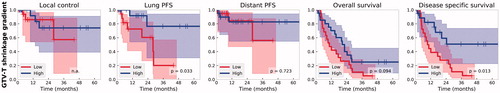
Table 1. Dose volume histogram parameters from the initial and adaptive, and the fraction-based combination (sum adaptive).
Supplemental material