
Figures & data
Figure 1. Experimental set-up and rationale for conducting the study. (A): Time series for FAZA-PET showing that in tumor-bearing mice (unlike patients), excellent hypoxia specificity is ultimately reached at late scan time points. We hypothesized that a clinical realistic intertissue and intratumoral image contrast is reached somewhere in the interval from 1 to 1.5 h PI (see section Discussion). (B): Invasive analysis confirming that late time PET scans in tumor-bearing mice are characterized by excellent hypoxia specificity (i.e., hypoxia maps are reliable). First row: Pimonidazole staining showing the distribution of pimonidazole adducts (hypoxic cells). Second row: Matching FAZA autoradiogram determined before pimonidazole staining using the same section. Last row: scatter plots showing the degree of spatial match between FAZA signal and density of hypoxic cells (segmented pimonidazole, see section Material and methods) using a pixel size of 1 mm2. It is clear that the distribution of tracer largely reflects the distribution of viable hypoxic cells. FAZA: 18F-azomycin arabinoside; PET: positron emission tomography.
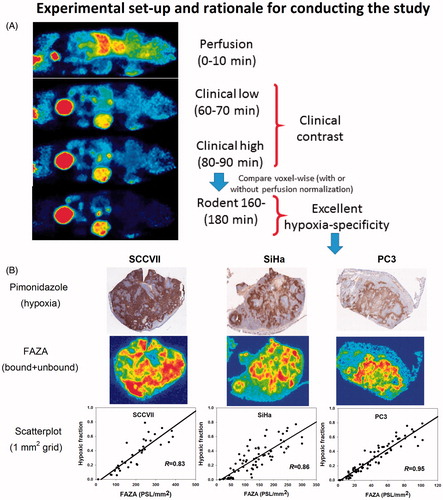
Figure 2. Scatterplot analysis for SCCVII. (A–C): PET images in two planes showing the time-dependent development of the intratumoral FAZA distribution in an SCCVII foot tumor. (D): whole-tumor TAC showing the distribution over time in average tumor tracer signal. (E): voxel-by-voxel correlation between late (PETlate: 160–180 min PI) and early (PETperf: 0–10 min PI) FAZA signal. (F): voxel-by-voxel correlation between PETlate and FAZA signal 60 min PI (PET60). (G): voxel-by-voxel correlation between PETlate and PET60 normalized to a perfusion surrogate measure derived as the average signal from 0 to 10 min PI (PET60/PETperf). FAZA: 18F-azomycin arabinoside; PET: positron emission tomography; PI: post-injection; TAC: time–activity curve.
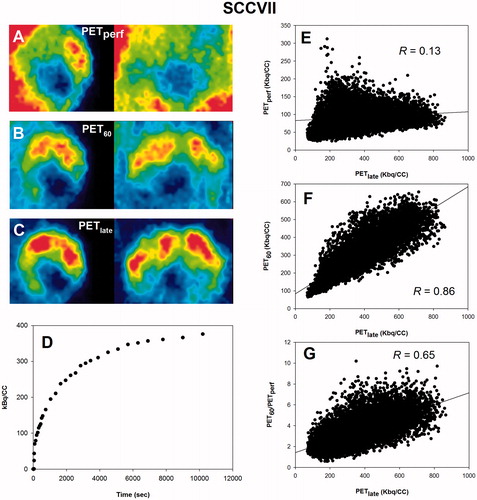
Figure 3. Scatterplot analysis for SiHa. (A–C): PET images in two dimensions showing the time-dependent development of the intratumoral FAZA distribution in an SiHa back tumor. (D): whole-tumor TAC showing the distribution over time in average tumor tracer signal. (E): voxel-by-voxel correlation between late (PETlate: 160–180 min PI) and early (PETperf: 0–10 min PI) FAZA signal. (F): voxel-by-voxel correlation between PETlate and FAZA signal 60 min PI (PET60). (G): voxel-by-voxel correlation between PETlate and PET60 normalized to a perfusion surrogate measure derived as the average signal from 0 to 10 min PI (PET60/PETperf). FAZA: 18F-azomycin arabinoside; PET: positron emission tomography; PI: post-injection; TAC: time–activity curve.
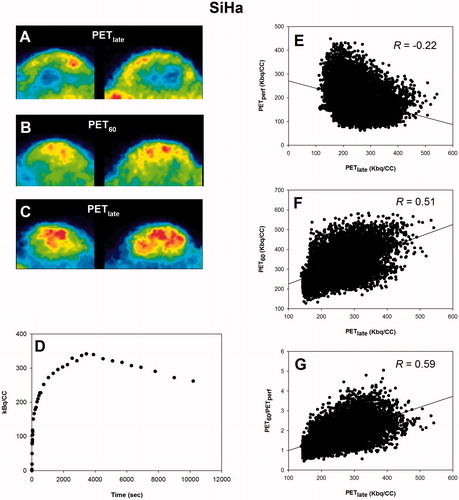
Figure 4. Scatterplot analysis for PC3. (A–C): PET images in two dimensions showing the time-dependent development of the intratumoral FAZA distribution in a PC3 back tumor. (D): whole-tumor TAC showing the distribution over time in average tumor tracer signal. (E): voxel-by-voxel correlation between late (PETlate: 160–180 min PI) and early (PETperf: 0–10 min PI) FAZA signal. (F): voxel-by-voxel correlation between PETlate and FAZA signal 60 min PI (PET60). (G): voxel-by-voxel correlation between PETlate and PET60 normalized to a perfusion surrogate measure derived as the average signal from 0 to 10 min PI (PET60/PETperf). FAZA: 18F-azomycin arabinoside; PET: positron emission tomography; PI: post-injection; TAC: time–activity curve.
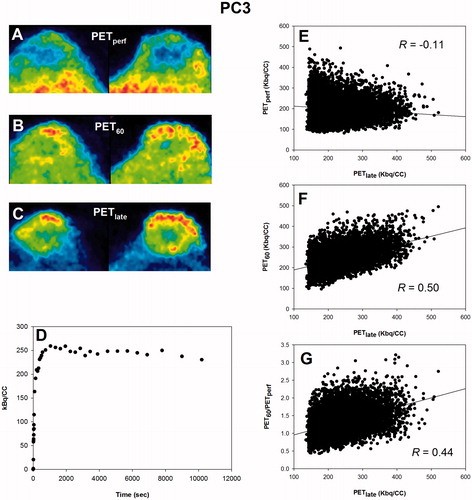
Table 1. Pearson regression coefficients (R) for different tumor models showing the voxel-by-voxel correlation between PET images derived at different imaging time points.