Figures & data
Table 1. Baseline characteristics and level of psychological distress.
Table 2. Univariate (UVA) and final multivariate (MVA) logistic regression analyses on potential baseline predictors for high level of psychological distress before palliative radiotherapy for painful bone metastases.
Figure 1. Mean scores of psychological distress (sum score ranges between 7 (low) and 28 (high)) at baseline (measurement 0) and after radiotherapy for painful bone metastases. (A) All patients (n = 1084) and all patients who still returned their questionnaires after 12 weeks (n = 679). (B) Patients with a high (n = 290), intermediate (n = 337) and low level (n = 457) of psychological distress at baseline. Y-axis: mean scores of psychological distress. X-axis: measurement. The first 12 measurements after baseline were taken weekly and thereafter monthly.
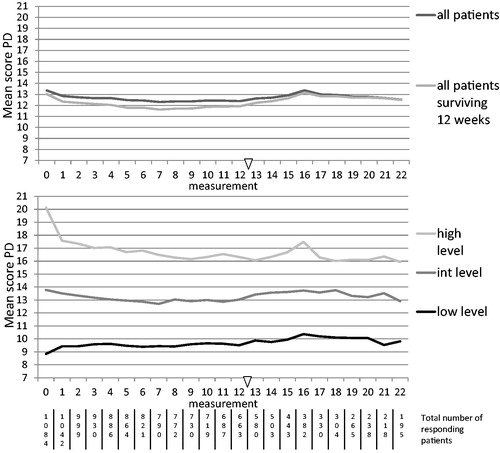
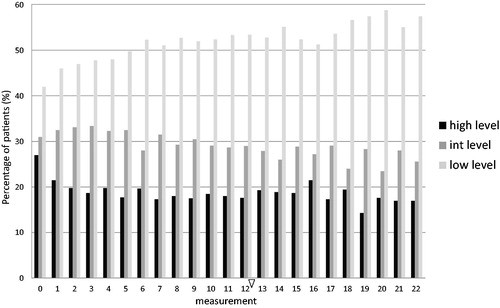
Figure 2. Percentage of patients with a low, intermediate or high level of PD during follow-up. Y-axis: percentage of patients. X-axis: measurement. The first 12 measurements after baseline were taken weekly and thereafter monthly.