Figures & data
Table 1. RPA and GPA classification.
Table 2. Baseline demographics and disease characteristics.
Figure 1. OS whole cohort. Cumulative percent: 21.7% of patients died at the first month, 43.1% at 2 months and 54.7% at 3 months after WBRT.
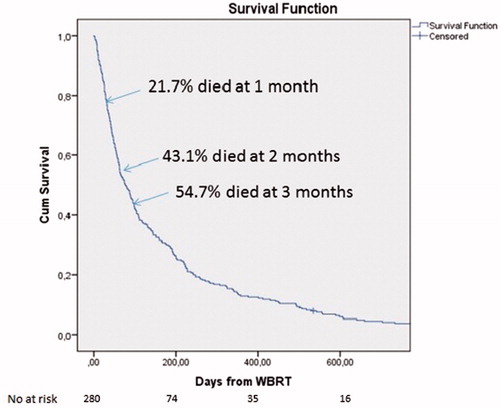
Figure 2. (A) OS analysis for RPA classes, pairwise log rank test has shown statistically significant difference with p < .0001 between RPA classes 1 versus 3 and 2 versus 3. (B) OS analysis for GPA groups, pairwise log rank test has shown statistically significant difference with p < .0001 between GPA groups 0 versus 1. (C) OS according to GPA for RPA class 2 subgroup (165 patients), there was a statistically significant OS difference between GPA group 0 (79 patients) and GPA group 1 (78 patients) with p = .004. (D) OS according to GPA/age for RPA class 2 subgroup, Group A: Age ≤70, GPA group 0 [41/165], group B: Age ≤70, GPA group 1 or 2 [66/165], group C: Age> 70, GPA group 1 or 2 [20/165] and group D: Age >70, GPA group 0 [38/165]. The pairwise log rank test showed a statistically significant difference in OS between groups A versus D (p = .036), as well as B vs D (p < .0001).
![Figure 2. (A) OS analysis for RPA classes, pairwise log rank test has shown statistically significant difference with p < .0001 between RPA classes 1 versus 3 and 2 versus 3. (B) OS analysis for GPA groups, pairwise log rank test has shown statistically significant difference with p < .0001 between GPA groups 0 versus 1. (C) OS according to GPA for RPA class 2 subgroup (165 patients), there was a statistically significant OS difference between GPA group 0 (79 patients) and GPA group 1 (78 patients) with p = .004. (D) OS according to GPA/age for RPA class 2 subgroup, Group A: Age ≤70, GPA group 0 [41/165], group B: Age ≤70, GPA group 1 or 2 [66/165], group C: Age> 70, GPA group 1 or 2 [20/165] and group D: Age >70, GPA group 0 [38/165]. The pairwise log rank test showed a statistically significant difference in OS between groups A versus D (p = .036), as well as B vs D (p < .0001).](/cms/asset/3acae2cb-518a-4a7f-87cd-82e103679c18/ionc_a_1386799_f0002_c.jpg)
Table 3. Univariate Cox regression analysis.
Table 4. Multivariate Cox-regression analyses for OS.
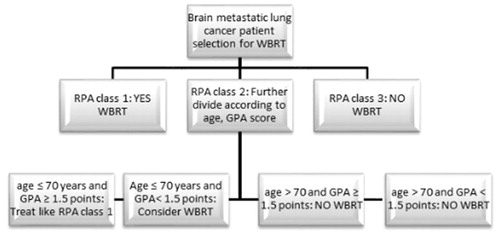
Figure 3. Diagram for the selection of brain metastasized lung cancer patients who should receive WBRT.