Figures & data
Table 1. Patient and tumor characteristics.
Figure 1. Panel A shows cumulative incidence for Breast Cancer Recurrence (BCR) of the 317 patients included in the intent to treat analysis who were randomly allocated to tamoxifen or placebo. Panel B shows the estimates in patients with confirmed ER positive or ER unknown tumors. Panel C shows the Kaplan–Meier estimates of overall survival of the 317 patients included in the intent to treat analysis who were randomly allocated to tamoxifen or placebo. The gray curves show the expected survival for the 317 patients, applying mortality figures of the general Danish population. Panel D shows the Kaplan–Meier estimates of overall survival in patients with confirmed ER positive or ER unknown tumors. Number of patients at risk are given below x-axes.
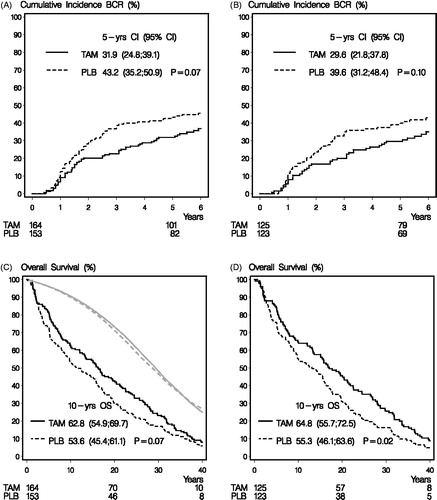
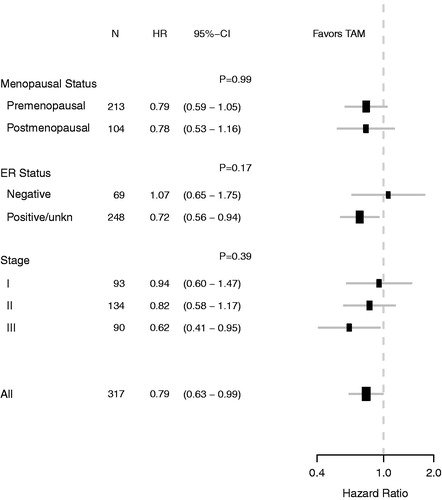
Figure 2. The forest plot illustrates exploratory subgroup analysis of overall survival according to menopausal status, ER status and Stage. Hazard ratios (HRs) refer to adjusted estimates obtained in the multivariate analysis of the intent-to-treat population. CI indicates 95% confidence interval. p-values are for test of heterogeneity of treatment effect.