
Figures & data
Table 1. Patient and tumor characteristics by subtype.
Figure 1. (Panel A) Cumulative Incidence estimates for recurrence (Rec) of systemically untreated patients with luminal A (Lum A), luminal B (Lum B), HER2-Enriched (HER2) and core basal (CB) breast cancer. (Panel B) Kaplan–Meier estimates of overall survival for systemically untreated patients with luminal A (Lum A), luminal B (Lum B), HER2-Enriched (HER2) and core basal (CB) breast cancer. Estimates for OS at 5, 10 and 20 years after surgery; Lum A 67% (60;73), 46% (39;53), 20% (14;25), Lum B 56% (51;61), 28% (24;33), 13% (10;16), HER2E 41% (30;51), 31% (21;41), 21% (13;31), core basal 42% (27;56), 35% (21;49), 16% (7;29). (Panel C) Kaplan–Meier estimates of disease-free survival (considering events of recurrence, contralateral breast cancer, other malignancy, and death as first event) for systemically untreated patients with luminal A (Lum A), luminal B (Lum B), HER2-Enriched (HER2) and core basal (CB) breast cancer. Patients at risk according to time after surgery listed below x-axis.
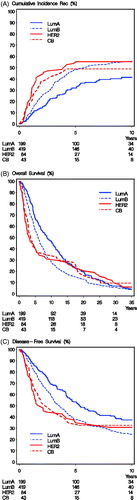
Table 2. Proportional hazards models for recurrence and overall survival according to subtype.
Table 3. Standardized mortality ratio according to subtype, overall and in relation to years after surgery.