
Figures & data
Table 1. Patients- and tumor characteristics of 112 Danish early Breast Cancer patients treated with neoadjuvant letrozole between 2009 and 2012.
Figure 1. Relative reduction (%) in tumor size for each of the 109 patients with records of clinical outcome (one bar per patient). No change (n = 26) visualized by a straight line, negative values symbolizes growth (n = 20) and positive values tumor reduction (n = 63). Groups represent clinical response according to RECIST 1.1; Complete response (n = 2), Partial response (n = 36), Stable disease (n = 57) and Progressive disease (n = 14).
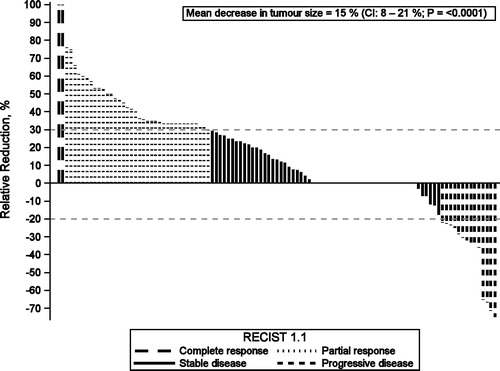
Table 2. Univariate analyses for factors associated with clinical and pathological outcome after neoadjuvant treatment with letrozole in early breast cancer patients.
Table 3. Association between biomarker change and clinical tumor change to pathological outcome after neoadjuvant treatment with letrozole in early breast cancer patients.