
Figures & data
Table 1. Baseline information on endocrine treatment, age and CCI.
Table 2. The distribution of fractures in 10 major groups.
Figure 1. The cumulative fracture incidence curves for endocrine treated breast cancer patients.
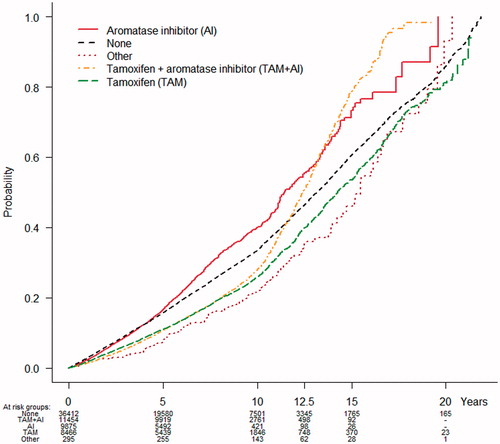
Table 3. Summary of the multivariable PWP regression analyzes for pre- and postmenopausal women.
Table 4. Summary of the final multivariable PWP regression analysis, all patients (n = 66,502).