
Figures & data
Table 1. Histological special subtypes and distribution of molecular intrinsic subtype including DR events and Deaths (any cause) (N = 89).
Table 2. Patient characteristics. Special subtypes (except for invasive lobular carcinoma) are not graded according to national guidelines [www.dbcg.dk].
Figure 1. Continuous relationship between 10-year risk of distant recurrence and the continuous PAM50-Prosigna ROR score by IDC and special subtypes. The figure shows for continuous ROR score (stated on x-axis) the 10-year risk of distant recurrence in percent (stated on y-axis) for each of the two subgroups, modeled by the Fine-Gray subdistribution hazards model.
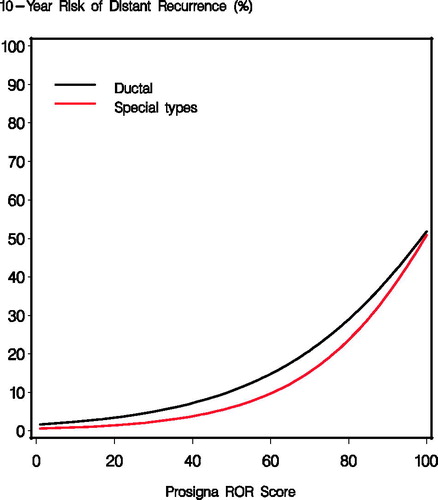
Figure 2. Cumulative incidence and overall survival according to ROR score low/intermediate versus high (A + C) and molecular subtype (B + D) for IDC and special types (black = ductal, red = special types).
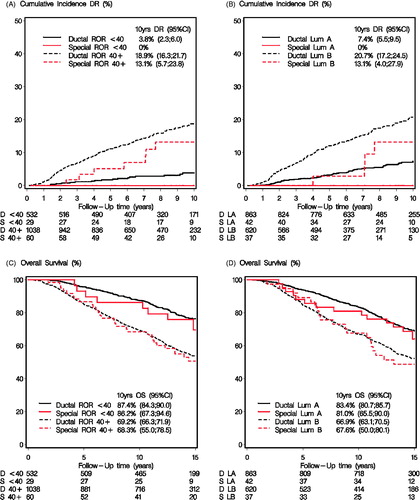
Figure 3. ▪
Table 3. Hazard Ratio (HR) estimates from multivariate analyzes for distant recurrence and overall survival.