Figures & data
Figure 1. Panel A: Distribution in percent of use of ALND according to year of surgery for patients with invasive breast cancer with micrometastases only in SN (N = 4869 for the period 2007–2016). Panel B: Distribution in percent of HER2 status according to year of surgery for patients with ER positive disease 60 years or older at diagnosis (N = 22,209).
![Figure 1. Panel A: Distribution in percent of use of ALND according to year of surgery for patients with invasive breast cancer with micrometastases only in SN (N = 4869 for the period 2007–2016). Panel B: Distribution in percent of HER2 status according to year of surgery for patients with ER positive disease 60 years or older at diagnosis (N = 22,209).](/cms/asset/65cfb03b-9193-408b-abe4-a80d56f4a7a9/ionc_a_1404638_f0001_c.jpg)
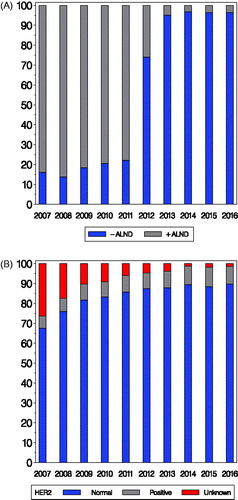
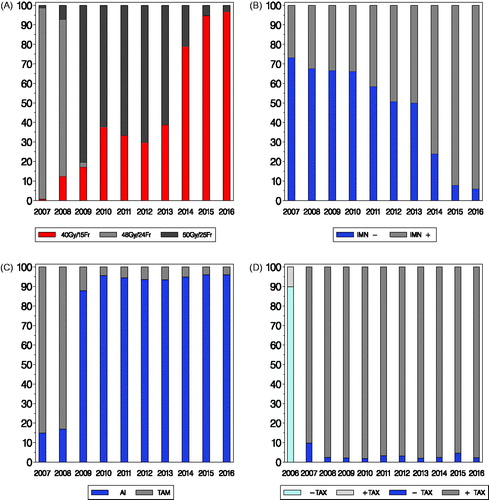
Table 1. Changes 2007–2016 in guidelines selected for data presentation.
Figure 2. Panel A: Distribution in percent of fractionation used for invasive breast cancer patients with breast only radiation therapy according to year of radiation (N = 15,005; patients in RT trials not included). Panel B: Distribution in percent of inclusion of IMN (internal mammary nodes) according to year of radiation for patients with loco-regional radiotherapy and left-sided breast cancer (N = 5805). Panel C: Distribution in percent of up-front treatment with either tamoxifen (TAM) or an aromatase inhibitor (AI) according to year of inclusion for postmenopausal patients allocated to endocrine treatment (N = 17,314; patients in trials for systemic treatment not included). Panel D: Distribution in percent of high-risk patients allocated to chemotherapy according to year of inclusion and whether chemotherapy was taxane based (N = 14,457).
![Figure 2. Panel A: Distribution in percent of fractionation used for invasive breast cancer patients with breast only radiation therapy according to year of radiation (N = 15,005; patients in RT trials not included). Panel B: Distribution in percent of inclusion of IMN (internal mammary nodes) according to year of radiation for patients with loco-regional radiotherapy and left-sided breast cancer (N = 5805). Panel C: Distribution in percent of up-front treatment with either tamoxifen (TAM) or an aromatase inhibitor (AI) according to year of inclusion for postmenopausal patients allocated to endocrine treatment (N = 17,314; patients in trials for systemic treatment not included). Panel D: Distribution in percent of high-risk patients allocated to chemotherapy according to year of inclusion and whether chemotherapy was taxane based (N = 14,457).](/cms/asset/ba113db3-1ad0-4e0e-ab18-40e62e9730dc/ionc_a_1404638_f0002_c.jpg)