Figures & data
Table 1. Contingency tables between manual reporting and data submitted to the data bank.
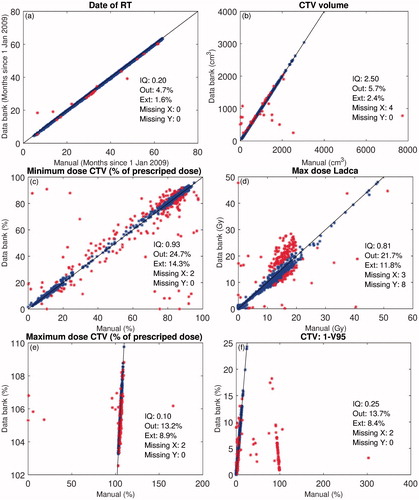
Figure 1. Comparison between values of manual and data bank for: date of RT, CTV volume, minimum dose to CTV, maximum dose to LADCA, CTV maximum, and 1-V95 values (Vx–x% of volume covered by the prescribed dose). IQ is the inter quartile range of the differences between the data bank and manual value. The percentage of outliers and extreme outliers (definition see text) is shown as well as the number of missing data on the x- and y-axis. Red points represent extreme outliers. Two points in subsection c with manual CTV values above 700% are outside the displayed area. Misunderstanding of the interpretation of the specific values in the manual reporting system is seen in subsection e–f, but most pronounced in subsection f.