Figures & data
Figure 1. Selection of patients for analysis of tumor-site recurrence and LN-site recurrence.
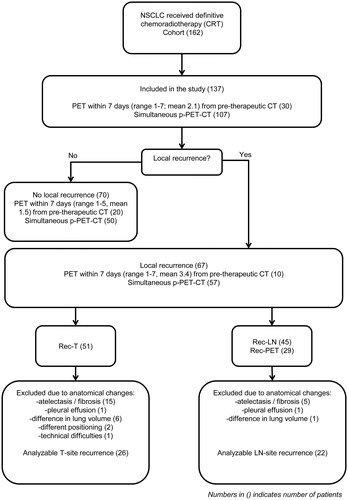
Figure 2. Progression free survival (PFS) and overall survival (OS) of patients treated with curative radiotherapy (137 pts).
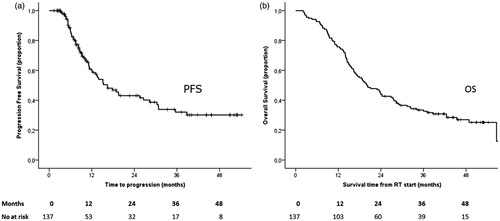
Table 1. Baseline clinical characteristics.
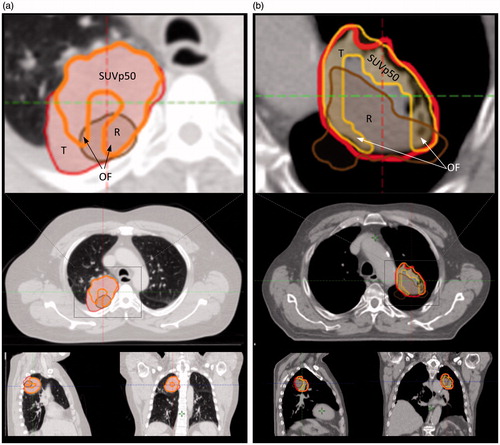
Figure 3. Two cases showing overlap between recurrence (rec) tumor (R, brown), SUVp50 (orange) and GTV-tumor (T, red) on planning-CT (p-CT). The p-CT and rec-CT were rigidly registered. The structures are shown on p-CT. (a) p-CT is represented in lung window showing T, SUVp50, R and the overlap fraction (OF) area. (b) p-CT representing a case with a donut shaped SUVp50 area resulting in low OFSUVp50 as tumor (GTV-T) was characterized necrotic in central part. Gross tumor volumes = red lines; recurrence tumor = brown lines, rigid registered on p-CT (left columns).