Figures & data
Table 1. Lifestyle scoring system within the different lifestyle behaviors ranging from 1 (low adherence) to 5 (high adherence).
Figure 1. Flow chart of patient recruitment, dropout and completion in the I CAN study.
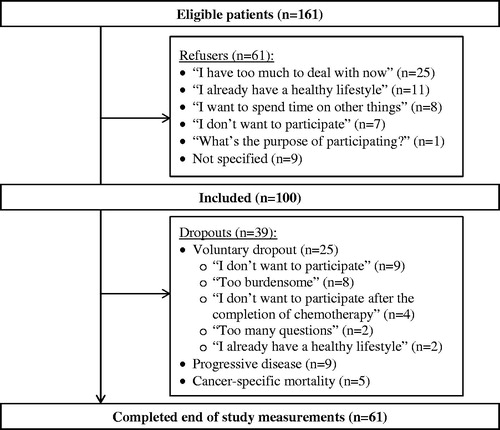
Table 2. Baseline socio-demographic and medical characteristics of I CAN participants, categorized by treatment intent (curative vs. palliative).Table Footnotea
Table 3 Absolute baseline lifestyle values from all participants also stratified into completers (n = 61) and dropouts (n = 39).Table Footnotea
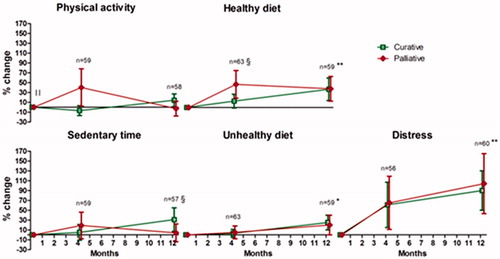
Figure 2. Twelve-month lifestyle changes. An improved percentage change is favorable for all lifestyle behaviors, based on the scores from . ǁStatistical significant difference between treatment intent groups at baseline (p < .05); §Statistical significant interaction between treatment intent group and visit number (p < .05); *Statistical significant improvement over time in all (p < .05) and ** (p < .001).