
Figures & data
Figure 1. Dice coefficient and percentage of stable radiomic features. NSCLC: non-small cell lung cancer; HNSCC: head and neck squamous cell carcinoma; MPM: malignant pleural mesothelioma. Median Dice coefficient was high for NSCLC and HNSCC, whereas it was very low for MPM. The stability rate of radiomic features correlated with the median Dice coefficient.
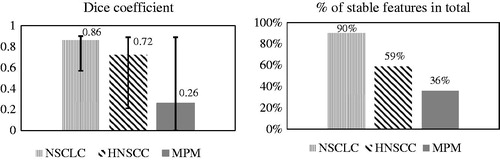
Figure 2. Dice coefficient and percentage of stable radiomic features according to feature subgroups. NSCLC: non-small cell lung cancer; HNSCC: head and neck squamous cell cancer; MPM: malignant pleural mesothelioma. A feature is considered to be stable with an intra-class correlation coefficient >0.8.
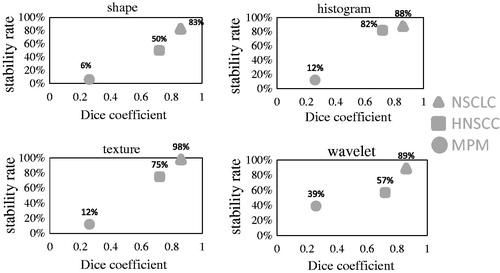
Table 1. Percentage of stable parameters (ICC >0.8) according to calculation method.