Figures & data
Figure 1. Pie charts illustrating the fraction of (A) men and women, (B) locations, and (C) histological types. (D) Total age-adjusted incidence rates per 100,000 for the total population for each year. (E) Median age at diagnosis for the different years. SCC: Squamous cell carcinoma; AC: adenocarcinoma; SG-AC: salivary gland type adenocarcinoma; NEC: neuroendocrine carcinoma; ENB: esthesioneuroblastoma.
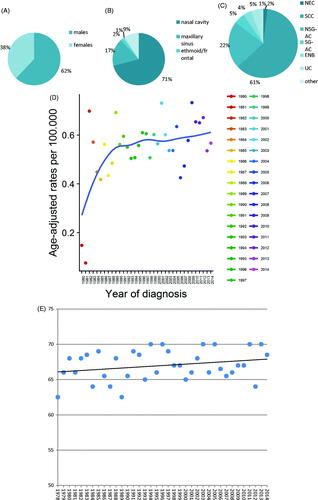
Table 1. Characteristics of patients with sinonasal carcinoma in Denmark and changes in incidence and survival.
Figure 2. Survival over time and number at risk. (A) Survival for different histologies. SCC: Squamous cell carcinoma; AC: adenocarcinoma; SG-AC: salivary gland type adenocarcinoma; NEC: neuroendocrine carcinoma; ENB: esthesioneuroblastoma. (B) Survival for different locations. DC300; nasal cavity, DC310; maxillary sinus, DC311/312; ethmoid and frontal sinus, DC313; sphenoid sinus, DC318/319; unspecified location. (C) Survival for men and women over time. (D) Survival according to year of diagnosis (in five year intervals).
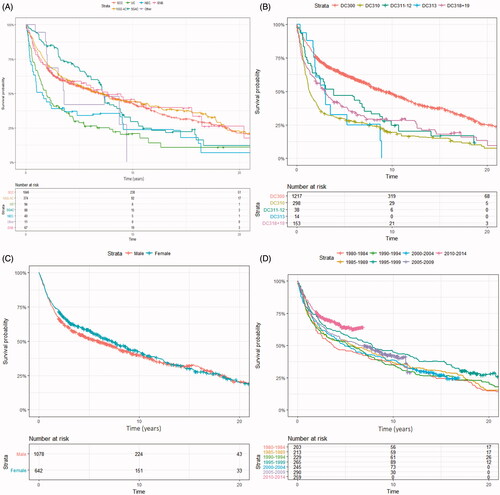
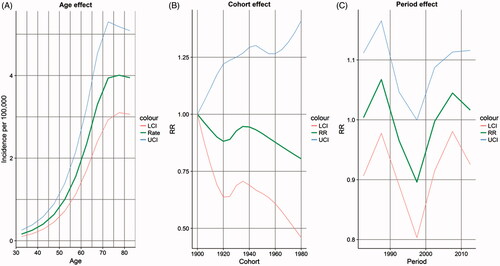
Figure 3. Total period effect. (A) Incidence for five-year age groups showing an increase in incidence in the older age groups. (B) Cohort effect and relative risk showing no significant difference in RR for the different cohorts. (C) Period and relative risk showing no significant difference in RR for the different periods. RR: relative risk; LCI: Lower confidens interval; UCI: Upper confidens interval.