
Figures & data
Table 1. Factor loadings for the symptoms associated with ‘radiation-induced urgency syndrome’Table Footnotea.
Figure 1. Organs at risk in lateral view: dark green: anal-sphincter; light green: rectum; orange: sigmoid; yellow: small intestines.
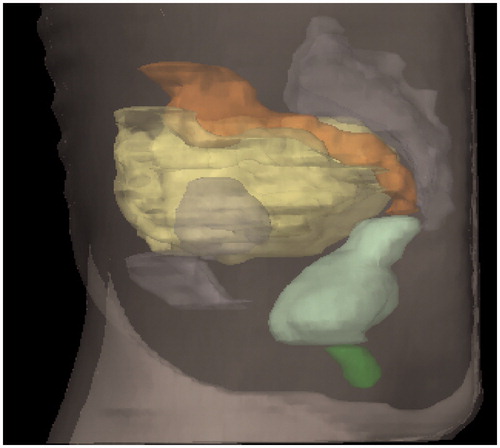
Table 2. Demographic, clinical characteristics and treatment characteristics of survivors with or without ‘radiation-induced urgency syndrome’ after pelvic radiation therapy.
Table 3. Mean and maximum absorbed doses for the three OARs, for patients with and without ‘radiation-induced urgency syndrome’ and correlation coefficients between mean and maximum absorbed doses.
Figure 2. Dose–response curves of mean dose to the rectum, sigmoid colon and the small intestine using the (a) Probit model, (b) the Relative Seriality (RS) model, (c) the LKB model and (d) the mean dose to the sigmoid colon for Probit, the Relative Seriality (RS) and the LKB models. The black x show the survivors with the syndrome, while the gray x show the survivors without the syndrome.
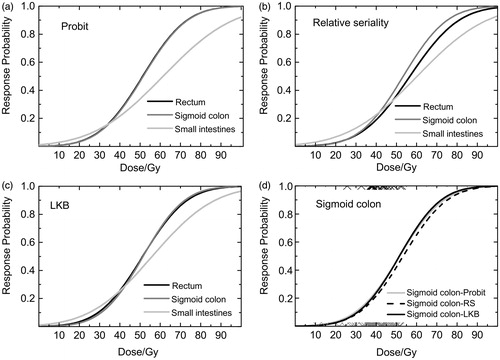
Table 4. The maximum likelihood estimates of the dose–response parameters for ‘radiation-induced urgency syndrome’ for the three OARs using Probit, RS, LKB and EUD models and the values for the AUC.