Figures & data
Table 1. Patient and treatment-related characteristics for both institutes.
Table 2. Scan parameters of the used MRI protocol.
Figure 1. An example of acquired MRI scans for one patient for one time point (pre scan). In (a) a T2W scan is shown with in (d) the coronal view of the same scan. (b) A b800 DW-MRI scan and its corresponding ADC-map in (c). In (e) the 24th scan of a DCE-MRI series is shown, during inflow of contrast in the tumor. The corresponding calculated AUC-map is found in (f).
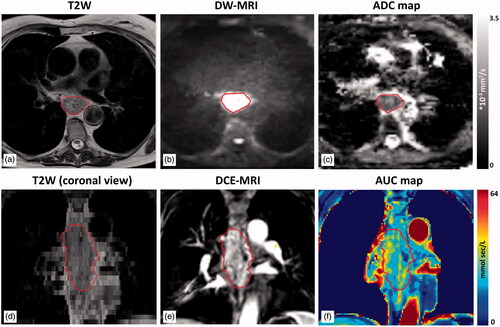
Figure 2. In (a) and (b) 90th percentile (P90) ΔAUCper-pre is presented as a function of response and in (c) and (d) 75th percentile (P75) ΔADCpost-pre. In (a, c) pathologic complete response (pCR) and no-pCR are differentiated while in (b, d) good response (GR) versus poor response is shown. Each dot represents a patient and the two institutes are indicated separately (UMCU in black/NKI in grey). The solid black line for each group represents the median. Threshold lines are indicated for which predictive values are calculated for separation based on response.
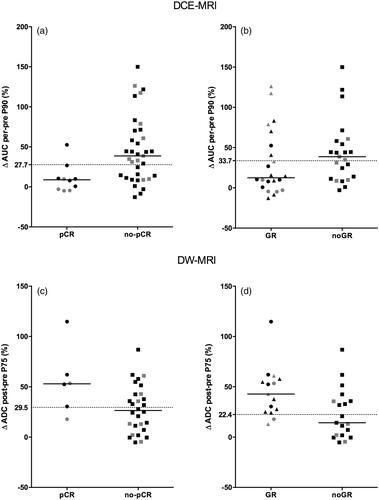
Table 3. Predictive values for both DW-MRI and DCE-MRI discriminating pCR versus no-pCR and GR versus noGR.
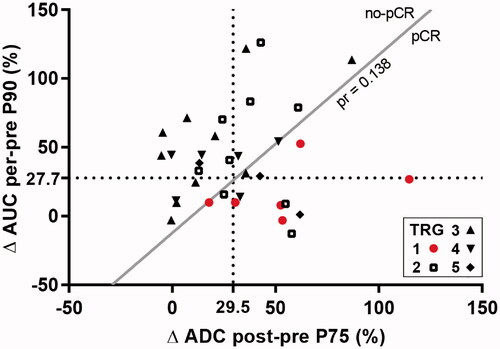
Figure 3. 90th percentile (P90) ΔAUCper-pre is plotted as function of 75th percentile (P75) ΔADCpost-pre. Each dot represents a patient and TRG scores are differentiated using different symbols, with pathologic complete response (pCR) highlighted in red. Equal thresholds from predicting pCR are indicated in dotted lines. The solid line represents the threshold line (separating pCR from no-pCR) from the multivariable logistic regression model, for which the probability equals 0.138.