
Figures & data
Figure 1. Overview of survivors of testicular cancer included in Survey I (1998–2002), Survey II (2007-2008) and present study.
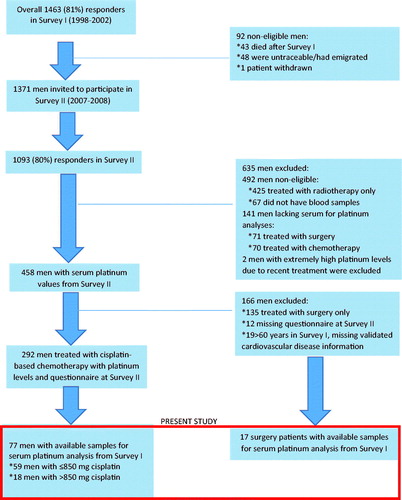
Table 1. Details on demographics, treatment and platinum levels.
Figure 2. (A) Pt levels at SI and SII for 94 participants, illustrated according to treatment modality and follow-up in years. Pt: platinum; cases: treated with chemotherapy; controls: treated with surgery only. (B) Pt levels at SI (blue dots) and SII (orange dots) for 77 CBCT-treated TCS, arranged according to follow-up time at SI. Pt: serum platinum; SI: survey I (1998–2002); SII: survey II (2007–2008); CBCT: platinum-based chemotherapy; TCS: testicular cancer survivors.
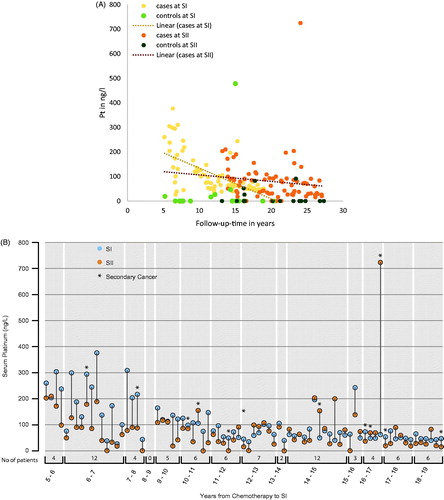
Figure 3. Cumulative risk of second cancer among all 76 men included in the analysis, and time to the second cancer diagnosis among 12 men diagnosed with second cancer after Survey II.
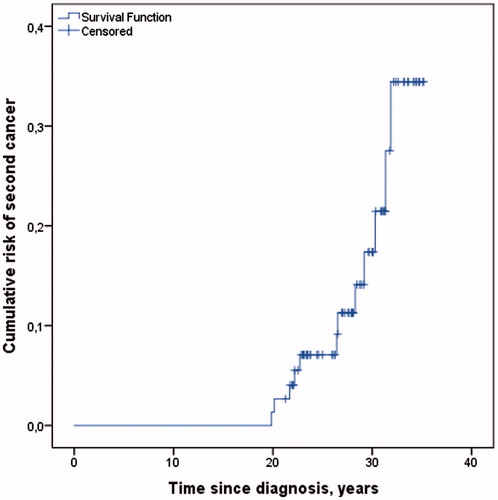
Table 2. Hazard ratios of second cancer diagnosed after survey II.
Figure 4. Median serum platinum at Survey I (SI) and Survey II (SII) for 77 testicular cancer survivors after chemotherapy, in different groups based on the renal function in either SI or SII and cumulative cisplatin dose.
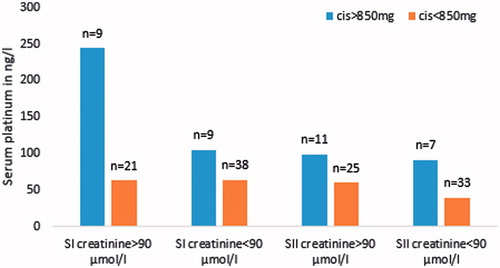
Table 3. Odds ratios of increased symptoms between SI to SII of paresthesias in hands and feet, Raynaud’s in hands and feet, tinnitus and hearing impairment using ordinal logistic regression models*.