Figures & data
Figure 1. Flowchart presenting the variety of treatments over three time periods.
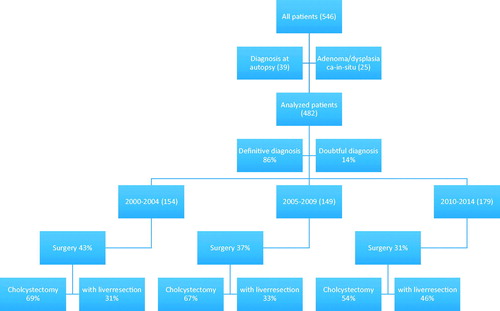
Table 1. Demographics, staging and grading of the patients.
Figure 2. (a) Survival for individuals whose diagnosis of GBC was histologically verified or based on clinical findings (p < .0001). (b) Survival over three time periods (p = .28). (c) Survival for individuals with stage M1 cancer. Period A versus Period B (p = .0005).
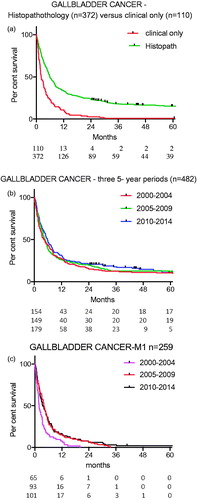
Table 2. Uni- and multivariable Cox regression analyses on survival.
Figure 3. Survival after curatively aiming operative procedures over three time periods (p = .02).
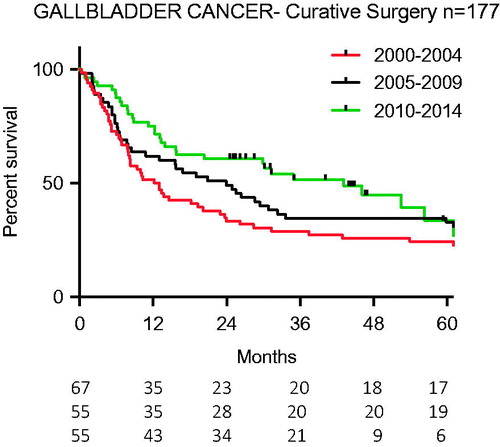
Table 3. Surgery with curative intent, by type of surgery.
Table 4. Uni- and multivariable Cox regression analyses on survival of patients undergoing surgery with curative intent (n = 177).
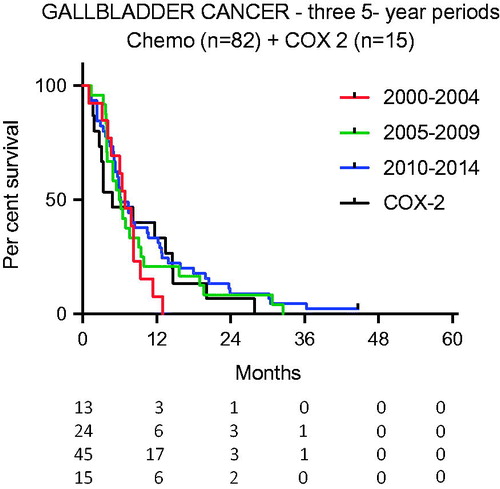
Figure 4. Survival after palliative chemotherapy over time and compared with patients given COX-2 (p = .40 and p = .74, respectively).