Figures & data
Figure 1. Population average DVHs for automatically generated robotic plans (autoROBOT, solid lines) and manually generated robotic plans (manual, dashed lines), the latter used for patient treatment.
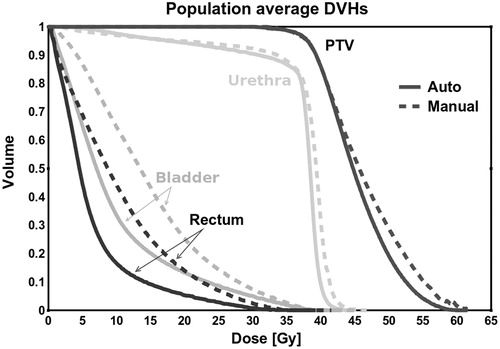
Figure 2. For all 20 patients, differences between autoROBOT and autoVMAT (left panels), or autoVMAT
(right panels), expressed as
with positive values representing better quality for autoROBOT. For dose bath percentage differences as
are expressed to compensate for differences in volumes (cm3) range between parameters. CI: conformity index (=patient volume receiving 38 Gy/PTV receiving 38 Gy).
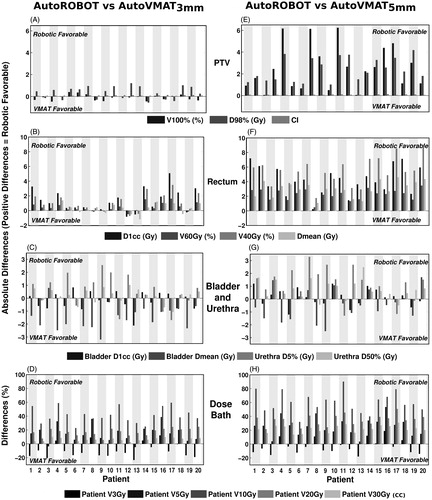
Table 1. For all 20 patients, comparisons of autoROBOT with autoVMAT and autoVMAT
plans.
Figure 3. Axial dose distributions for autoROBOT, autoVMAT and autoVMAT
, for patients 17 (upper panels) and 13 (lower panels). These patients demonstrated the most pronounced advantage in rectum dose for autoROBOT instead of autoVMAT (patient 17), and the most pronounced advantage using autoVMAT compared to autoROBOT (patient 13) (see also Figure 2(B,F)). Red contour: PTV (3 mm or 5 mm), orange contour: rectum, blue contour: bladder and yellow contour: urethra.
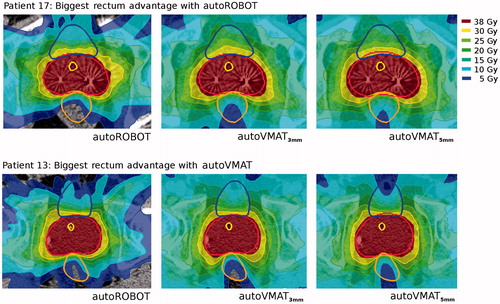
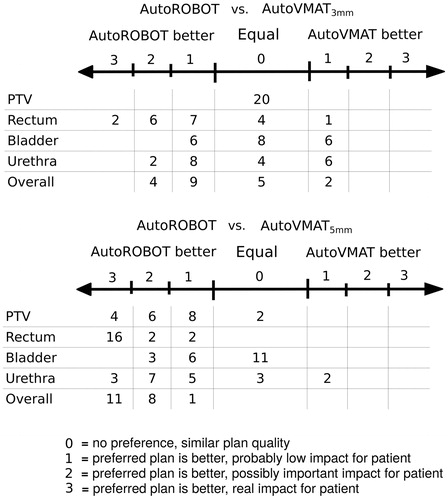
Figure 4. Visual analogue scale (VAS) used for blind side-by-side plan comparisons by the treating clinician, and clinician scoring with the values representing numbers of plans (for each line, the sum values equal to 20).