
Figures & data
Table 1. Sociodemographic characteristics of the sample from the Health and Health Complaints project of CentERdata at T1.
Table 2. Mean baseline and change scores (standard deviations in parentheses) of EORTC QLQ-C30.
Figure 1. EORTC QLQ-C30 scores by sex and age over time. Figure is based on data from those that completed five assessments (n = 967).
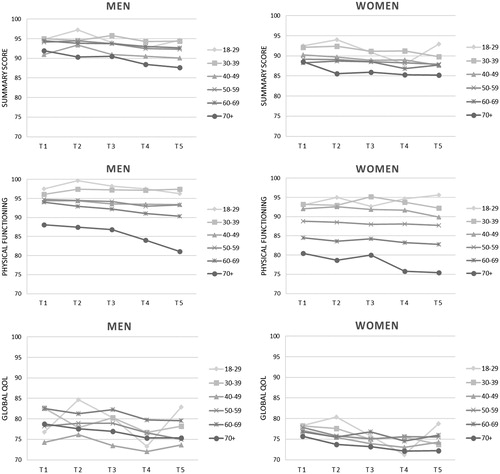
Table 3. Mean baseline and change scores (standard deviations) of EORTC QLQ-C30.