
Figures & data
Figure 1. Flow chart of patients included in the analyses at baseline and at the one year follow-up. Please note that 33 patients answered the questionnaire at the one year follow-up, but not at baseline. One centre was excluded due to poor inclusion. *Baseline questionnaires were distributed after diagnosis, prior to start of treatment.
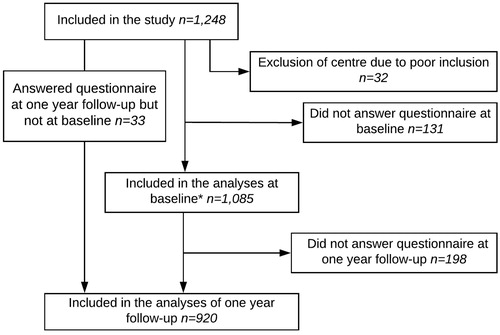
Table 1. Demographics and clinical data for patients in the QoLiRECT patient cohort at baseline, after diagnosis prior to treatment.
Table 2. Description of all the patients (n = 198) and a subgroup analysis of the patients with palliative treatment (n = 37) that answered the baseline questionnaire but did not answer the questionnaire at the one year follow-up.
Figure 2. Descriptive data of the patients’ experience of the overall communication at the surgical clinic over time, by repeated measures. Black indicates baseline (n = 1085) and grey (n = 920) the one year follow-up. *‘Neither yes nor no’ and ‘Do not know’ where only used as an answer alternative in the one year follow-up questionnaire.
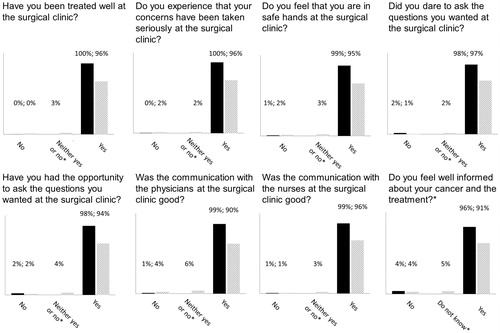
Figure 3. Descriptive data of patients’ (n = 920) assessments of sufficient information regarding the specified subjects at the one year follow-up.
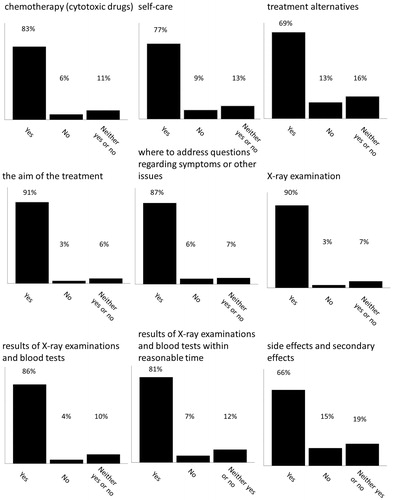
Figure 4. Descriptive data of the patients’ assessments of the received information regarding potential side-effects of chemotherapy. Data were collected from the questionnaire distributed one year after diagnosis.
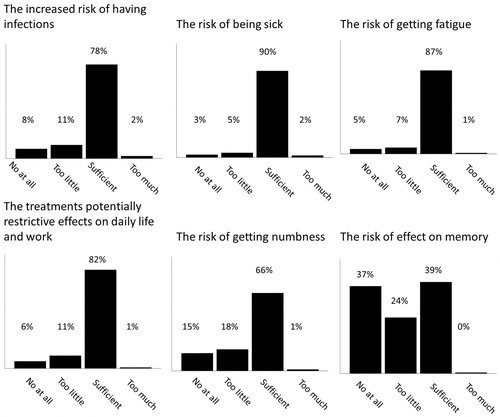
Table 3. Descriptive data of number of patients that stated they talked with their physician about the planned treatment’s possible effects on anatomy and functionality.
Table 4. Descriptive data of the patients with palliative care (n = 42) experience of the overall communication at the oncological clinic.