Figures & data
Table 1. Patient characteristics.
Figure 1. ROC-curves for the AMC cohort (training) and Maastro cohort (validation) for the random forest models based on (a) 40 radiomic features and (b) 6 clinical variables.
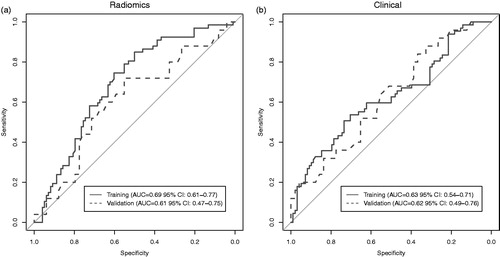
Figure 2. Survival curves of the (a) AMC cohort (training) and (b) Maastro cohort (validation). Division in risk groups was based on the predictions by the random forest model with radiomics features.
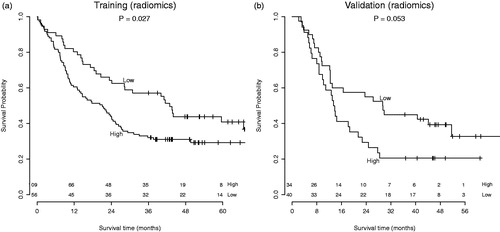
Figure 3. Survival curves of the (a) AMC cohort (training) and (b) Maastro cohort (validation). Division in risk groups was based on the predictions by the random forest model with clinical variables.
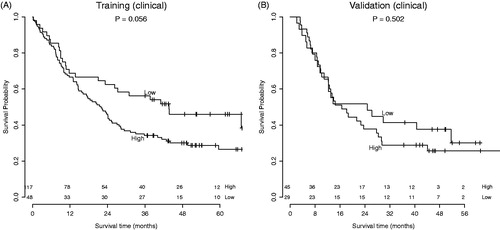
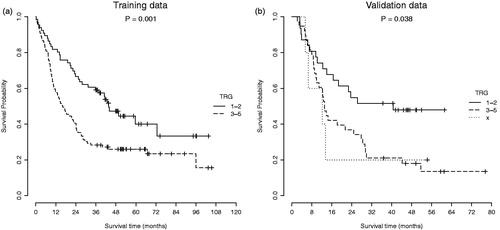
Figure 4. Survival curves of the (a) AMC cohort (training) and (b) Maastro cohort (validation). Division in risk groups was based on the pathological response in the primary tumor.